
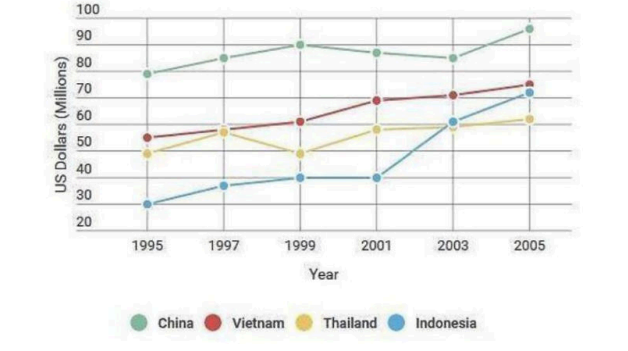
The line graph compares car expenditures among residents in four distinct countries in Asia. Overall, the number of money spent on cars in all four countries increase throughout the period. Additionally, China remained the dominant spender for this category of transportation, while Indonesia saw the most significant growth and ultimately overtake Thailand at the end. Both China and Vietnam stayed as the highest spenders with an upward trend-trajectory during the 10-year period. China started off with around $76 million in 1995, before reaching its interim peak of approximately $87 million 4 years later, and finishing the period at roughly $94 million in 2005. In contrast, car expenditures in Vietnam experience a gradual increase over the years and ended as the second-highest, under China, of approximately $72 million. In 1995, Thailand spent approximately $9 million more than Indonesia. Thailand's spending fluctuated between around $46 million and $56 million over the first 6 years, and reaching just over $60 million in 2005. Meanwhile, Indonesia saw the largest growth. Its spending climbed steadily to around $37 million in 2001, over Thailand's figure in 2003, and then surged sharply to approximately $71 million by the end of the period.
Sample Detail
The line graph below shows how much money was spent on cars in four different countries in Asia
22/07/2026 18:57 7.0 points
Topic
The line graph below shows how much money was spent on cars in four different countries in Asia
Word count: 195
Chart/Graph
Essay
Overall Scores
7.0±0.5
Good
Writing Criteria Scores
TA7.0
CC7.0
LR7.0
GRA7.0
Click on any highlighted text in the essay to view detailed suggestions for improvement.
Deep Analysis
Task 1 - Academic Writing
4 tools available
Sample Essay - IELTS Writing Task 1
No sample essay
Click the button below to analyze and generate a high-quality sample essay for Task 1.