
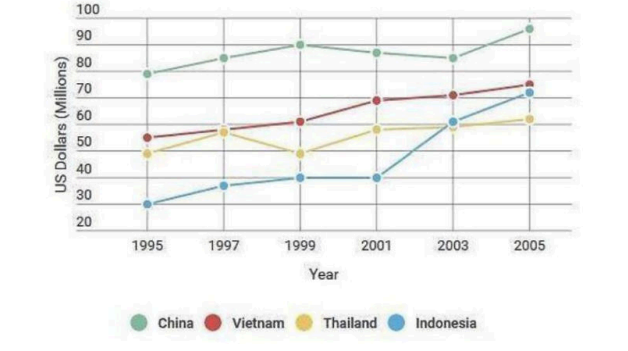
The line graph compares car expenditures among residents in four distinct countries in Asia. Overall, the amount of money spent on cars in all four countries increased throughout the period. Additionally, China remained the dominant spender for this category of transportation, while Indonesia saw the most significant growth and ultimately overtake Thailand at the end. Both China and Vietnam stayed as the highest spenders with an upward trend during the 10-year period. China expenditures started off with around $76 million in 1995, before reaching its interim peak of approximately $87 million 4 years later, and finishing the period at roughly $94 million in 2005. In contrast, car expenditures in Vietnam experienced a gradual increase over the years and ended as the second-highest, under China, of approximately $72 million. In 1995, Thailand spent approximately $9 million more than Indonesia. Thailand's spending fluctuated between around $46 million and $56 million over the first 6 years, and reached just over $60 million in 2005. Meanwhile, Indonesia saw the largest growth. Its spending climbed steadily to around $37 million in 2001, overtook Thailand's figure in 2003, and then surged sharply to approximately $71 million by the end of the period.
Detail Sampel
The line graph below shows how much money was spent on cars in four different countries in Asia
22/07/2026 19:02 7.5 skor
Topik
The line graph below shows how much money was spent on cars in four different countries in Asia
Jumlah kata: 196
Grafik/Diagram
Essay
Skor Keseluruhan
7.5±0.5
Baik
Skor Kriteria Writing
TA8.0
CC8.0
LR7.0
GRA8.0
Klik teks yang ditandai di esai untuk melihat saran detail untuk peningkatan.
Analisis mendalam
Task 1 - Academic Writing
4 tools available
Esai contoh - IELTS Writing Task 1
Belum ada esai contoh
Silakan klik tombol di bawah untuk menganalisis dan membuat esai contoh berkualitas tinggi untuk Task 1.