
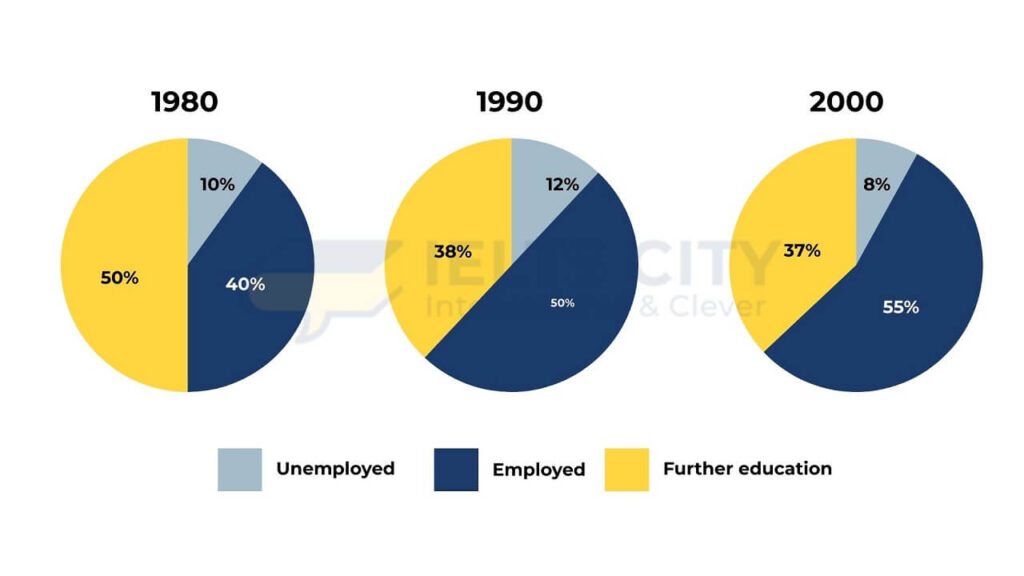
The pie graphs portray what Australian learners planned after graduating secondary school in seperate years: 1980, 1990 and 2000. The initial impression from the charts is that Australia's employed students hold the dominant position in most of the years, except for 1980, which belonged to further education. The year 1980 recorded a half in the proportion of higher education, exhibiting the primary figure. This is followed by comparable percentage of pupils in Australia who recieved employment at 40%, which was precisely four times that of unemployed learners. In the next decade, the rate of employed graduaters ascended by 10% and overtook that of futher education plans. Meanwhile, Australian school leavers who kept studying documented a drop in percentage to 38%, accounting approximately a third in total. Ultimately, there was an insignificant increase of just 2% unemployed students. In 2000, employed learners in Australia continuously grew to 55%. By contrast, the choice of further education witnessed a complete reversal trend of 1%, from 38% to 27%. Despite climbing in the first two decades, the proportion of secondary school graduaters who did not gain employment moderately declined to 8%, holding the modest figure among categories.
รายละเอียดตัวอย่าง
The charts show the Australian school leavers did immediately after leaving secondary school. Summarise the information by selecting and reporting the main features, and make comparison where relevant.
22/07/2026 19:10 6.5 คะแนน
หัวข้อ
The charts show the Australian school leavers did immediately after leaving secondary school. Summarise the information by selecting and reporting the main features, and make comparison where relevant.
จำนวนคำ: 193
แผนภูมิ/กราฟ
Essay
คะแนนรวม
6.5±0.5
ดีพอใช้
คะแนนเกณฑ์การเขียน
TA7.0
CC7.0
LR6.0
GRA7.0
คลิกข้อความที่ไฮไลต์ในเรียงความเพื่อดูคำแนะนำรายละเอียดเพื่อพัฒนา
การวิเคราะห์เชิงลึก
Task 1 - Academic Writing
4 tools available
บทความตัวอย่าง - IELTS Writing Task 1
ยังไม่มีบทความตัวอย่าง
กดปุ่มด้านล่างเพื่อวิเคราะห์และสร้างบทความตัวอย่างคุณภาพสูงสำหรับ Task 1