
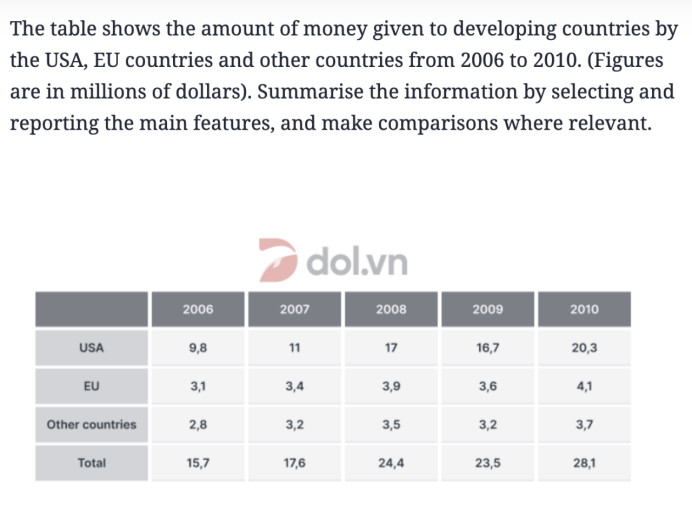
The given table illustrates how much money the USA,EU and other countries gave to developing nations from 2006 to 2020,measured in millions of dollars. Overall, there was an increase in the amount of money was given to developing nations by the USA, EU countries and others, with the most dramatic rise being seen in the figure for USA to become the most contributor nation from 2008 onwards. In 2006,the amount of money which was given by the United States to less developed nations started at 9,8 , after which it experienced a substantial increase to 11 by 2007 and continued to rise to 17 after one year. While the EU contributed 3,1 millions of dollars to developing nations in the initial year, the figure then increased continually from 3,1 to 3,9 over two years. Meanwhile, the amount of money was given by other nations to developing countries was lower, standing at 2,8 millions of dollars in 2006. Moreover, the figure rose gradually from 3,2 to 3,5 in 2008, which make the overall amount of money was provided to developing nations witnessed a sharp growth, rising from 15,7 to 24,4 throughout three years. In 2009, 16,7 millions of dollars were recorded in developing nations that was given by the United States, the amount of money far exceeded those of the EU and other countries, with respective figures being 3,6 and 3,2 millions of dollars. In 2010, while the United Stated saw an upward trend in the amount of money donated to developing nations, contributing 20,3 millions of dollars, which was nearly five times higher than that of the figures for other nations and the EU, representing 3,7;4,1 millions of dollars respectively. Therefore, a sharp increase was witnessed in the amount of money that was given by different countries, growing considerably from 23,5 to 28,1 millions of dollars in 2010.
Sample Detail
The table shows the amount of money give to developing countries by the USA, EU countries and other countries from 2006 to 2010.
22/07/2026 19:18 5.5 points
Topic
The table shows the amount of money give to developing countries by the USA, EU countries and other countries from 2006 to 2010.
Word count: 308
Chart/Graph
Essay
Overall Scores
5.5±0.5
Basic
Writing Criteria Scores
TA6.0
CC6.0
LR6.0
GRA5.0
Click on any highlighted text in the essay to view detailed suggestions for improvement.
Deep Analysis
Task 1 - Academic Writing
4 tools available
Sample Essay - IELTS Writing Task 1
No sample essay
Click the button below to analyze and generate a high-quality sample essay for Task 1.