
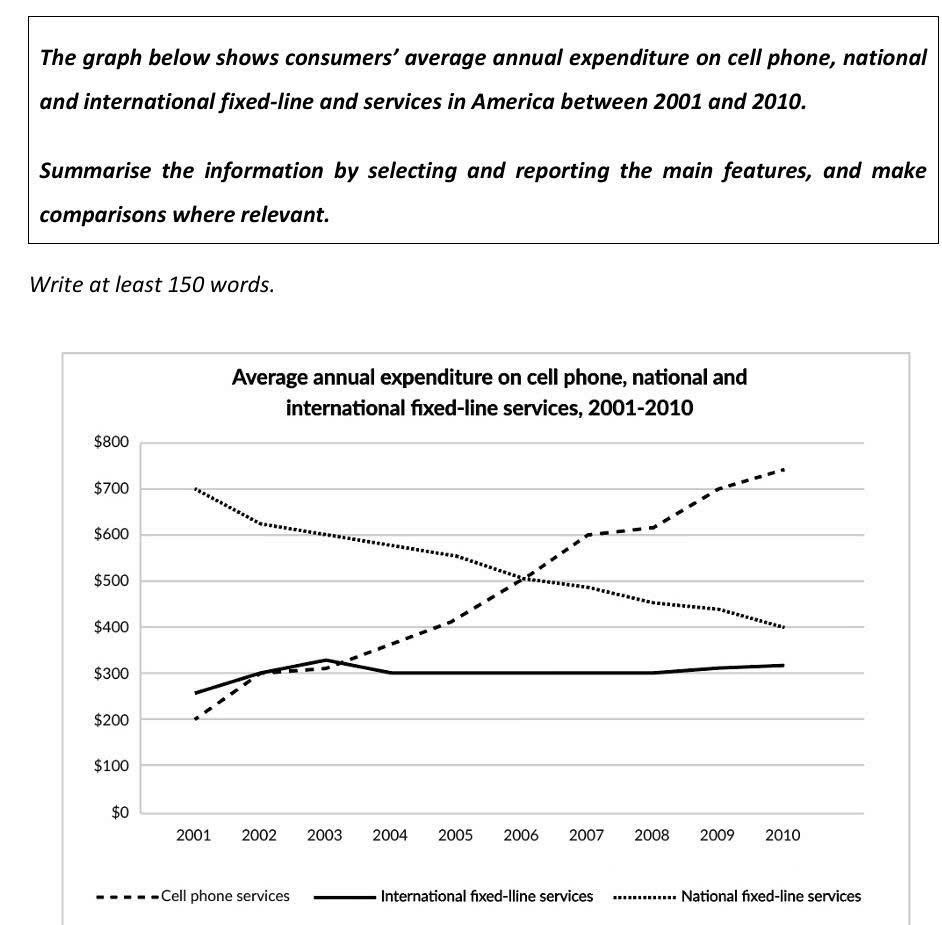
The line graph illustrates changes in the average consumer expenditure on three different telecommunication services in America from 2001 to 2010 Overall, the period saw a significant change in consumer spending habits. While national fixed-line expenditure decline steadily, cellphone spending surged to become the highest cost category, whereas international fixed-line costs remained stable and low In 2001, national fixed-line services were the most expensive, starting at $700 annually. Throughout the decade, this category experienced a continuous downward trend, reaching $400 by 2010. International fixed-line services remained the most stable category, starting at $250 in 2001, peaking at slightly over $300 in 2003, and then stabilizing at approximately $300 for the rest of the period Cell phone services began as the lowest expenditure category at #200 in 2001. Spending rose rapidly, crossing the national fixed-line levels around 2006. By 2010, cell phone expenditure peaked at approximately $750, making it the most significant cost for consumers
Sample Detail
The graph below shows consumers' average annual expenditure on cell phone, national and international fixed-line and services in America between 2001 and 2010 Summarise the information by selecting and reporting thhe main features, and make comparisons where relevant
22/07/2026 19:33 6.5 points
Topic
The graph below shows consumers' average annual expenditure on cell phone, national and international fixed-line and services in America between 2001 and 2010 Summarise the information by selecting and reporting thhe main features, and make comparisons where relevant
Word count: 154
Chart/Graph
Essay
Overall Scores
6.5±0.5
Fair
Writing Criteria Scores
TA7.0
CC7.0
LR7.0
GRA6.0
Click on any highlighted text in the essay to view detailed suggestions for improvement.
Deep Analysis
Task 1 - Academic Writing
4 tools available
Sample Essay - IELTS Writing Task 1
No sample essay
Click the button below to analyze and generate a high-quality sample essay for Task 1.