
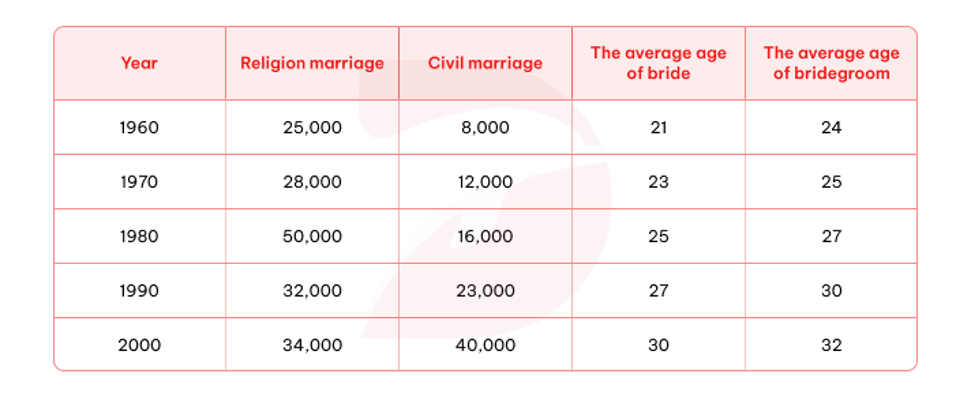
The given graph provided information on Australian’s marriage situations and age between 1960 and 2000. Overall, while religious marriages fluctuated throughout the period, civil marriages rose steadily and eventually overtook religious marriages by 2000. In addition, both the average age of bride and bridegroom became older over time. In 1960, religion marriage recorded only 25 thousand cases, it then rose significantly to its peak, at 50 thousand in 1980. After that, the figure dropped dramatically to 32 thousand cases in 1990, before recovering to 34 thousand by the end of the period. Meanwhile, civil marriage increased steadily throughout the period, from 8 thousand cases in 1960 to 40 thousand in 2000. Notably, this figure surpassed the number of religious marriages for the first time, marking significant shift in marriage trends. Regarding the average age at marriage, both bride and bridegroom became progressively grew older over the four decades. The average age of brides rose from 21 in 1960 to 30 in 2000, while that of bridegrooms increased from 24 to 32 over the same period. Throughout the entire period, bridegrooms were consistently around 2 to 3 years older than brides on average.
รายละเอียดตัวอย่าง
The table below gives information about the situation of marriage and age from 1960 to 2000 in Australia.
22/07/2026 20:05 6.5 คะแนน
หัวข้อ
The table below gives information about the situation of marriage and age from 1960 to 2000 in Australia.
จำนวนคำ: 192
แผนภูมิ/กราฟ
Essay
คะแนนรวม
6.5±0.5
ดีพอใช้
คะแนนเกณฑ์การเขียน
TA7.0
CC7.0
LR6.0
GRA7.0
คลิกข้อความที่ไฮไลต์ในเรียงความเพื่อดูคำแนะนำรายละเอียดเพื่อพัฒนา
การวิเคราะห์เชิงลึก
Task 1 - Academic Writing
4 tools available
บทความตัวอย่าง - IELTS Writing Task 1
ยังไม่มีบทความตัวอย่าง
กดปุ่มด้านล่างเพื่อวิเคราะห์และสร้างบทความตัวอย่างคุณภาพสูงสำหรับ Task 1