
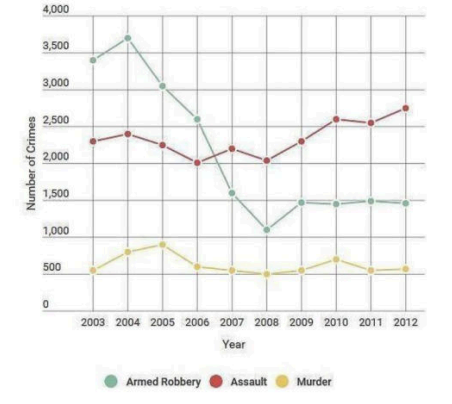
The data illustrates the quantity of serious offenses that took place in London from 2003 to 2012 Overall, the number of armed robbery cases experienced a dramatic decline in the, while assaults saw an upward trajectory, and murders remained relatively stable despite fluctuations. Notably, the occurrence of armed robberies had the most significant change. In 2003, the figure started at just over 3,300 crimes and had a slight increase to approximately 3,600 cases 1 year later. Additionally, this number witnessed its biggest fall during the period to roughly 2,600 in 2008, before falling further to approximately 1,450 in 2010 and remaining stable at around the same level towards the end of 2012. In contrast, the number of assault cases fluctuated in the first 7 years, with its figures between 2,300 and 1,900 crimes. However, there was a growth to just over 2,500 in 2012 and finished the period at approximately 2,650. The amount of murder cases throughout the period experienced moderate fluctuations, with the highest peak at roughly 800 crimes, before dropping and remaining relatively steady at 500 in 2012.
รายละเอียดตัวอย่าง
The line graph below shows the number of serious crimes that occured in London between 2003 and 2012
22/07/2026 20:18 6.5 คะแนน
หัวข้อ
The line graph below shows the number of serious crimes that occured in London between 2003 and 2012
จำนวนคำ: 180
แผนภูมิ/กราฟ
Essay
คะแนนรวม
6.5±0.5
ดีพอใช้
คะแนนเกณฑ์การเขียน
TA7.0
CC7.0
LR7.0
GRA6.0
คลิกข้อความที่ไฮไลต์ในเรียงความเพื่อดูคำแนะนำรายละเอียดเพื่อพัฒนา
การวิเคราะห์เชิงลึก
Task 1 - Academic Writing
4 tools available
บทความตัวอย่าง - IELTS Writing Task 1
ยังไม่มีบทความตัวอย่าง
กดปุ่มด้านล่างเพื่อวิเคราะห์และสร้างบทความตัวอย่างคุณภาพสูงสำหรับ Task 1