
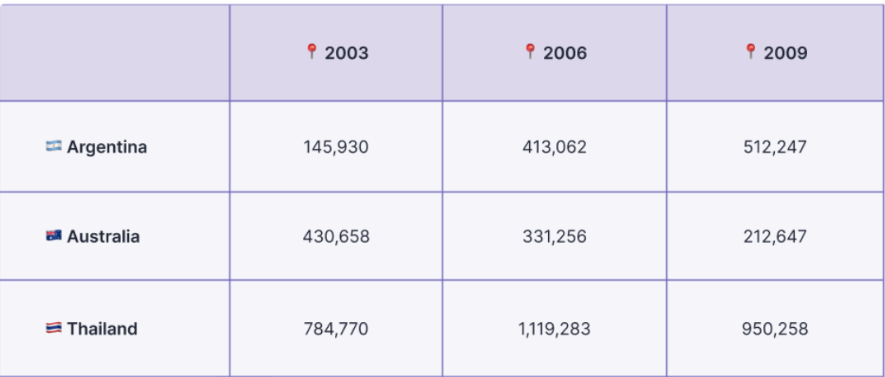
The statistics illustrate how many cars were produced in three nations ( Argentina, Australia, and Thailand) over a 6-year period, starting from 2003. Overall, what is notable from the chart is that the number of cars produced in Argentina and Thailand witnessed an increase, with Thailand rising and dipping slightly at the end, while Australia had the opposite category. Thailand consistently had the highest figure, whereas Australia consistently recorded the lowest number. At the start of the period, in 2003, Thailand started with the highest products at 784,770 cars, and emerged as the leading category. Far below was Australia, with 430,658 cars, while the figure for Argentina was considerably different from 145,930 items. Thereafter, Thailand experienced significant rise in the number of products with sharply climbed to 1,119,283 in 2006, before a noticeable slipped with 950,258 items in 2009. Similarly, the number of cars produced in Argentina recorded a rise from 413,062 cars in 2006 to 512,247 items in 2009, remaining as the second highest in this vehicle. In contrast, this group in Australia decline from 331,256 items in 2006 to 212,647 cars at the end.
Detail Sampel
The table below shows the number of cars made in three countries from 2003 to 2009. Summarize the information by selecting and reporting the main features and make comparisons where relevant.
22/07/2026 21:11 6.5 skor
Topik
The table below shows the number of cars made in three countries from 2003 to 2009. Summarize the information by selecting and reporting the main features and make comparisons where relevant.
Jumlah kata: 186
Grafik/Diagram
Essay
Skor Keseluruhan
6.5±0.5
Cukup
Skor Kriteria Writing
TA7.0
CC7.0
LR6.0
GRA6.0
Klik teks yang ditandai di esai untuk melihat saran detail untuk peningkatan.
Analisis mendalam
Task 1 - Academic Writing
4 tools available
Esai contoh - IELTS Writing Task 1
Belum ada esai contoh
Silakan klik tombol di bawah untuk menganalisis dan membuat esai contoh berkualitas tinggi untuk Task 1.