
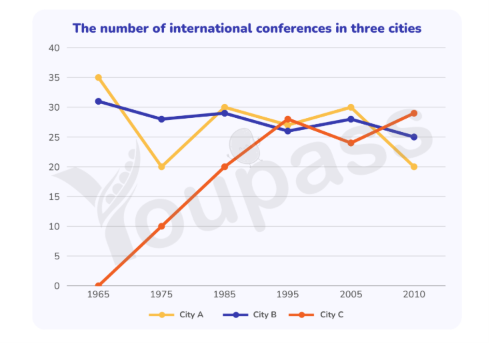
The graph illustrates the number of international conferences was organized across three capital cities between 1965 to 2010. Overall, the figure for city C was lowest of the graph, while city A had the most number of international conferences in 1965. In 2010, however, C is the city had the most conferences, whereas city A had the least. Meanwhile, city B remained relatively stable. After over five decades, the figures for city A and city C consistently fluctuated. In 1965, the number of international conferences of city A was 35, city B was approximately 31 while city C was without conference. However, in the following five years, the figure for city C increased remarkably to 10 conferences, while city C decreased significantly to 20. Meanwhile, the city C's conferences declined slightly to 28. In 1985, the city C's conferences continued to rise to 20, the number of conferences of city B was steady growth to 29, and city A also increased dramatically to 30. In 1995, both the number of conferences in city A và B decreased steadily, at 25 and 24, respectively, whereas city C continued to rise to about 28 before falling significantly to 24 in 2005 and reached a peak of approximately 29 in 2010. Meanwhile, both the figures for city A and city C increased slightly before falling again in 2010.
Detail Sampel
The graph shows the information about international conferences in 3 capital cities in 1965-2010. Summarize the information and make comparisons where relevant.
22/07/2026 21:47 5.0 skor
Topik
The graph shows the information about international conferences in 3 capital cities in 1965-2010. Summarize the information and make comparisons where relevant.
Jumlah kata: 225
Grafik/Diagram
Essay
Skor Keseluruhan
5.0±0.5
Dasar
Skor Kriteria Writing
TA5.0
CC5.0
LR5.0
GRA5.0
Klik teks yang ditandai di esai untuk melihat saran detail untuk peningkatan.
Analisis mendalam
Task 1 - Academic Writing
4 tools available
Esai contoh - IELTS Writing Task 1
Belum ada esai contoh
Silakan klik tombol di bawah untuk menganalisis dan membuat esai contoh berkualitas tinggi untuk Task 1.