
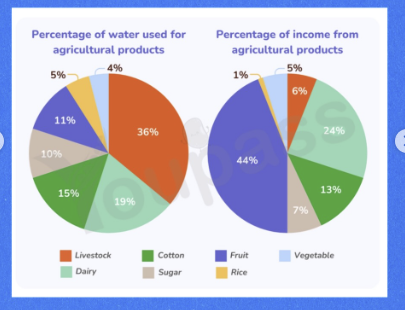
The pie charts show the information about the proportion of water used for agricultural products and the share of income from these categories in Australia in 2004. Overall, it was notable that while livestock required the highest use of water, fruit was by far excessive the most profitable agricultural products despite the amount of water consumed was significantly small. Looking first at livestock, the share of water used for it was about 36%, but its value contributed to the Australian’s overall income at 6%. Cotton used 15% of water and generated 13% of income for Australia. Sugar consumed 10% of the percentage of water but contributed a slightly smaller share of revenue at 7%. Lastly, rice witnessed a similar pattern which consumed 5% water and achieved only 1% of income. In contrast, Fruit used a small percentage of water, just 11% but created 44% of income, making it the most valued agricultural product. The respective figures for dairy products were about 19% of water and generated 24% of income, becoming the second most valuable products in Australia.
รายละเอียดตัวอย่าง
he charts below show the use of water for agricultural products in Australia in 2004 and the value of these products to the Australian economy in the same year.Summarize the information by selecting and reporting the main features and make comparisons where relevant.
23/07/2026 07:57 6.5 คะแนน
หัวข้อ
he charts below show the use of water for agricultural products in Australia in 2004 and the value of these products to the Australian economy in the same year.Summarize the information by selecting and reporting the main features and make comparisons where relevant.
จำนวนคำ: 177
แผนภูมิ/กราฟ
Essay
คะแนนรวม
6.5±0.5
ดีพอใช้
คะแนนเกณฑ์การเขียน
TA7.0
CC7.0
LR6.0
GRA6.0
คลิกข้อความที่ไฮไลต์ในเรียงความเพื่อดูคำแนะนำรายละเอียดเพื่อพัฒนา
การวิเคราะห์เชิงลึก
Task 1 - Academic Writing
4 tools available
บทความตัวอย่าง - IELTS Writing Task 1
ยังไม่มีบทความตัวอย่าง
กดปุ่มด้านล่างเพื่อวิเคราะห์และสร้างบทความตัวอย่างคุณภาพสูงสำหรับ Task 1