
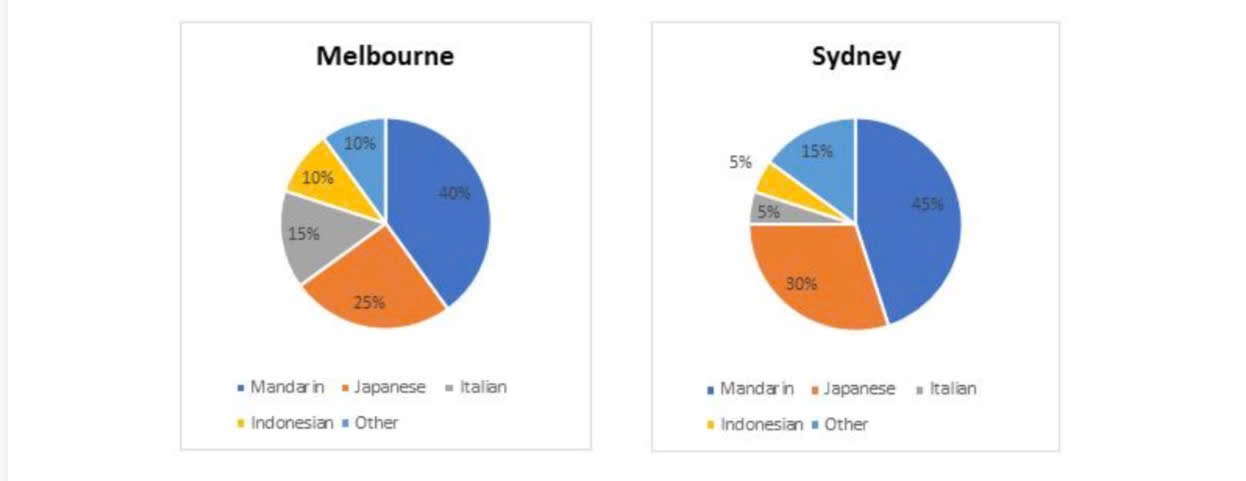
The given pie charts demonstrates the percentage of second language classes taken by Australian secondary school learners in Melbourne and Sydney in 2017. The most outstanding figure is that Mandarin emerges as the most prominent language of all students. With regards to the rate of second language which children learn in secondary school in Melbourne, notably Mandarin ranked first, occupying 40%, and far surpassing others. This was followed by Japanese, with figure registering at a quarter. The lowest data can be seen in both Indonesian and Other, which accounted for just one-tenth, significantly less than the remaining categories. Shifting the focus to the percentage of second language in Sydney, apparently, it showcases a similar pattern. One marked disparity is evident in Japanese as the rate constitutes 5% higher than that of Melbourne. Similarly, Other languages outnumbers that of Melbourne, with gap being 5%. In contrast, Italian and Indonesian are less prominent, exhibiting minimal shares of both 5%, compared to 15% and one-tenth of Melbourne.
नमूना विवरण
Summarise the information by selecting and reporting the main features, and make comparisons where relevant.
23/07/2026 08:07 6.0 अंक
विषय
Summarise the information by selecting and reporting the main features, and make comparisons where relevant.
शब्दों की संख्या: 164
चार्ट/ग्राफ
Essay
समग्र स्कोर
6.0±0.5
ठीक
राइटिंग मानदंड स्कोर
TA6.0
CC6.0
LR6.0
GRA6.0
सुधार के विस्तृत सुझाव देखने के लिए लेख में किसी भी हाइलाइट किए गए टेक्स्ट पर क्लिक करें।
गहन विश्लेषण
Task 1 - Academic Writing
4 उपकरण उपलब्ध
नमूना लेख - IELTS Writing Task 1
कोई नमूना लेख नहीं
Task 1 के लिए उच्च-गुणवत्ता वाला नमूना लेख विश्लेषण और बनाने के लिए नीचे दिए गए बटन पर क्लिक करें।