
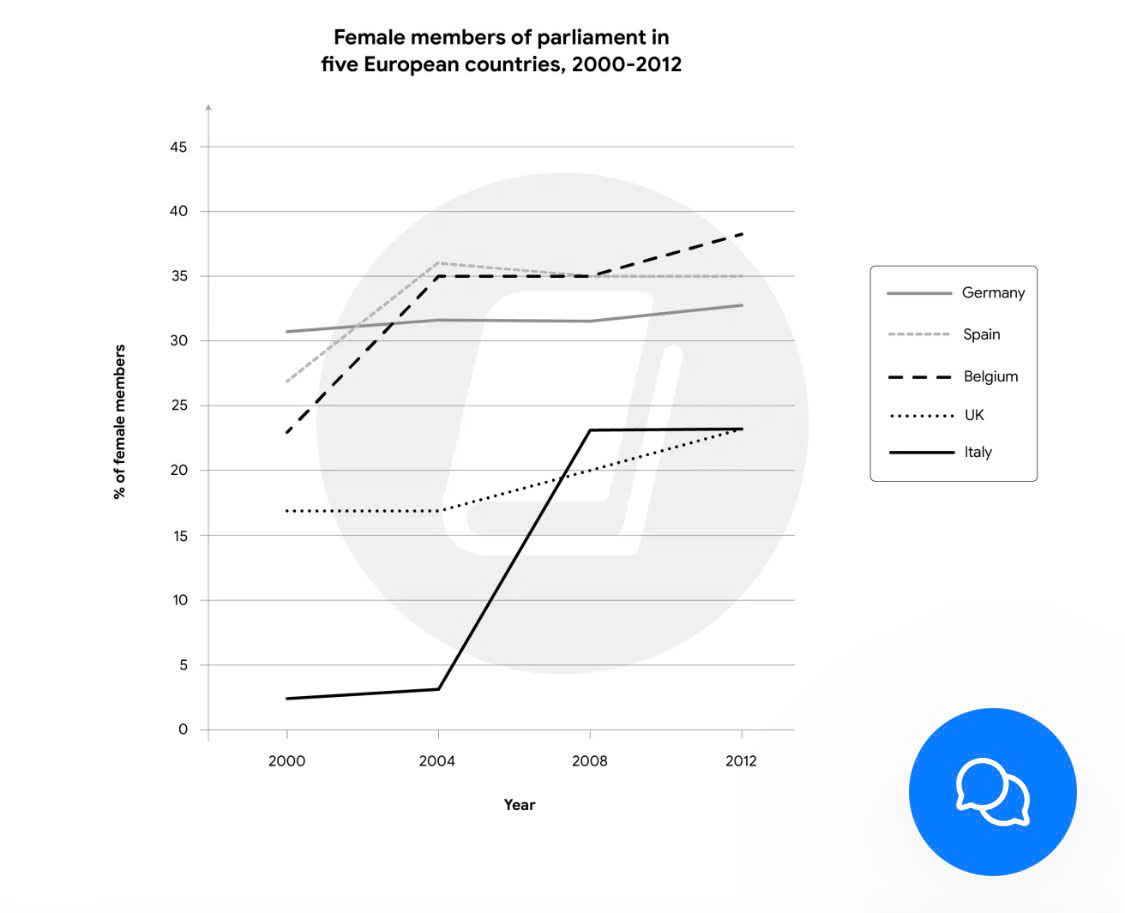
The given line chart illustrates the percentage of female members of parliament in five European countries between 2000 and 2012. Overall, it is clear that the proportion of female members of parliament in all five European countries increased throughout the period. Noticeably, Germany had the highest percentage of female in the paliment in 2000 but Belgium ended up in the leading position by 2012 , whereas the Italy consistently recorded the lowest. Additionally, Germany had the highest proportion of female member of paliment in 2000, account for 31%. This figure remained unchanged before rose slightly to about 33% in 2012. Meanwhile, Spain grew rapidly from around 27% in 2000 to peak at approximately 36% in 2004, before stayed at the same level at 35% in 2012. Besides, Belgium had the most significant growth in this group, they started at nearly 23% and climbed steadily to reach the highest overall percentage of nearly 38% by the end of the period. Futhermore, the percentage of female member of paliment in UK began at around 17% in 2000, and increased marginally , made up for 23% in 2012 . Moreover, female member of paliment in Italy had the lowest during the period, at 3%. After that, it rose dramatically at roughly 23% in 2008 and stablized in the end , had a similar level with UK.
নমুনা বিস্তারিত
You have approximately 20 minutes to complete this task. The graph below shows the percentage of female members of parliament in five European countries between 2000 and 2012.Provide an overview of the information by identifying and describing the key details, and include comparisons where appropriate. Your report should comprise a minimum of 150 words. The graph below shows the percentage of female members of parliament in five European countries between 2000 and 2012
23/07/2026 08:07 5.5 স্কোর
টপিক বা বিষয়
You have approximately 20 minutes to complete this task. The graph below shows the percentage of female members of parliament in five European countries between 2000 and 2012.Provide an overview of the information by identifying and describing the key details, and include comparisons where appropriate. Your report should comprise a minimum of 150 words. The graph below shows the percentage of female members of parliament in five European countries between 2000 and 2012
শব্দ সংখ্যা: 223
চার্ট/গ্রাফ
Essay
সামগ্রিক স্কোর
5.5±0.5
প্রাথমিক
রাইটিং মানদণ্ড স্কোর
TA6.0
CC6.0
LR5.0
GRA6.0
উন্নতির জন্য বিস্তারিত পরামর্শ দেখতে প্রবন্ধের হাইলাইট করা যেকোনো লেখায় ক্লিক করুন।
গভীর বিশ্লেষণ
Task 1 - Academic Writing
4 tools available
নমুনা রচনা - IELTS Writing Task 1
কোনো নমুনা রচনা নেই
টাস্ক ১-এর জন্য উচ্চমানের নমুনা রচনা বিশ্লেষণ এবং তৈরি করতে নিচের বাটনে ক্লিক করুন।