
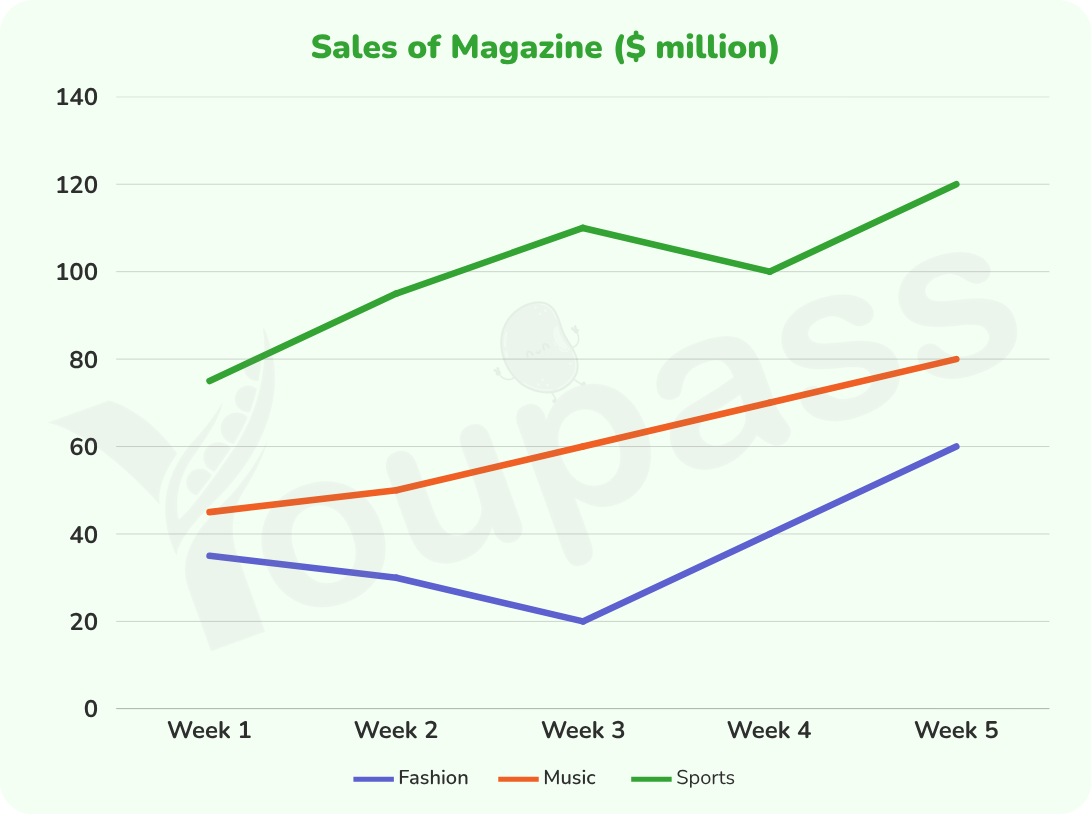
The line chart illustrates the shift in sales of fashion, music and sports magazines in an area for five weeks. Overall, it is evident that the revenue of sports reached a peak for this period, the music magazines constantly soar and the slight fluctuation of fashion section. As regards sports, the statistic began at under 80 million dollars, then it rocketed to approximately over 100 million dollars at week three. Before a dramatical fall to 100 million dollars in the next week, the sport sales have peaked the second highest point for this time. Although the sports sales plunged about 10 units million dollars at week four, it rapilly reach the peak at 120 million dollars and became the best seller category. In terms of fashion, Despite a average surge over five weeks at 60 million dollars, the sales of fashion experienced a huge decrease in two early weeks. Subsequently, fashion section evidenced a great period, with 40 units increased from 20 units to 60 units in last week. The music sales rose with stable growth, started at higher 40 units and ended with nearly 40 units increased.
Detail Sampel
The chart below shows sales of three categories of magazines (fashion, music, and sports) in a particular region over five weeks. Summarise the information by selecting and reporting the main features, and make comparisons where relevant.
23/07/2026 08:17 6.5 skor
Topik
The chart below shows sales of three categories of magazines (fashion, music, and sports) in a particular region over five weeks. Summarise the information by selecting and reporting the main features, and make comparisons where relevant.
Jumlah kata: 188
Grafik/Diagram
Essay
Skor Keseluruhan
6.5±0.5
Cukup
Skor Kriteria Writing
TA7.0
CC7.0
LR6.0
GRA6.0
Klik teks yang ditandai di esai untuk melihat saran detail untuk peningkatan.
Analisis mendalam
Task 1 - Academic Writing
4 tools available
Esai contoh - IELTS Writing Task 1
Belum ada esai contoh
Silakan klik tombol di bawah untuk menganalisis dan membuat esai contoh berkualitas tinggi untuk Task 1.