
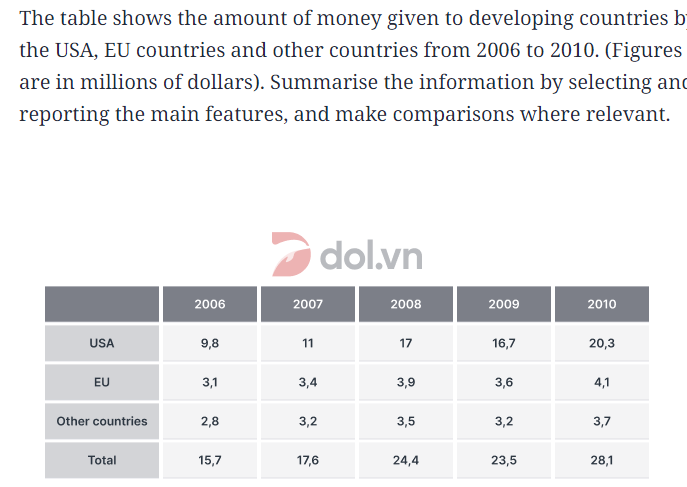
The table illustrates the amount of money given to developing countries by the United States, European Union contries and other countries over a period of 5 years (Figure are meansure in millions of dollar). Overall, the USA was the prevelant throughout the period. While EU and other contries gave smaller amount of budget. In addition, the total section compared the contributions of various nation over years. In 2006, the USA donated 9,8 million dollars and rose to 11 million dollars and increased significantly 17 million in 2008 before falling slightly in 2009. By the end of the period, the figure had more than doubled, reaching a peak of 20,3 million dollars. While the EU was given smaller amount of money. It climbed steadily from 3,1 million dollars in 2006 to 3,9 million dollars and later dropping to 3,6 million dollars in the following year and finishing at 4,1 million dollars in 2010. The amount donated by other countries began at 2,8 million dollars in 2006 before increasing gradually to 3,2 million in 2007 and 3,5 million in 2008. The figure then fell slightly to 3.2 million dollars in 2009. For the remaining period, it rose modestly to 3,7 million dollars in 2010. As a result, the total increased over the 5 years period. It stood at 15,7 million dollars in 2006 and grew up steadily to 17,6 million in 2007 before increasing significantly to 24,4 million in 2008. Although the figure dropped slightly to 23,5 million dollars in 2009, it recovered to 28,1 million dollars in the final year, which was the highest figure recorded during the period.
নমুনা বিস্তারিত
The table shows the amount of money given to developing countries by the USA, EU countries and other countries from 2006 to 2010. (Figures are in millions of dollars). Summarise the information by selecting an reporting the main features, and make comparisons where relevant.
23/07/2026 08:20 5.5 স্কোর
টপিক বা বিষয়
The table shows the amount of money given to developing countries by the USA, EU countries and other countries from 2006 to 2010. (Figures are in millions of dollars). Summarise the information by selecting an reporting the main features, and make comparisons where relevant.
শব্দ সংখ্যা: 268
চার্ট/গ্রাফ
Essay
সামগ্রিক স্কোর
5.5±0.5
প্রাথমিক
রাইটিং মানদণ্ড স্কোর
TA7.0
CC6.0
LR5.0
GRA5.0
উন্নতির জন্য বিস্তারিত পরামর্শ দেখতে প্রবন্ধের হাইলাইট করা যেকোনো লেখায় ক্লিক করুন।
গভীর বিশ্লেষণ
Task 1 - Academic Writing
4 tools available
নমুনা রচনা - IELTS Writing Task 1
কোনো নমুনা রচনা নেই
টাস্ক ১-এর জন্য উচ্চমানের নমুনা রচনা বিশ্লেষণ এবং তৈরি করতে নিচের বাটনে ক্লিক করুন।