
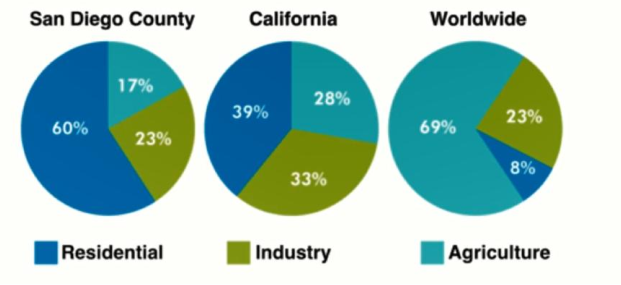
The pie chart illustrates the comparison of water consumption in San Diego, California, and the total for the global. Overall, agriculture was the largest user worldwide. Regionally, residential recorded the highest figure in San Diego and Cali; by contrast, agriculture was the lowest consumer in these two areas. First of all, residential consumption reached the peak of water in two regions: San Diego and Cali, with a figure of 60 percent and 39 percent, respectively. But globally, residential hit a low percentage of 8 percent, which was one of the lowest compared to 3 categories. Regarding the remaining brackets, industry had a stable figure in three regions, with 23% in San Diego, 33% in California and 23% in the world. The other was agriculture, which accounted for the lowest proportion in San Diego and Cali with 17% and 28%; however, it had the dominant feature in worldwide, which exceeded the other two at 69%.
Sample Detail
The pie charts below compare water usage in San Diego, California and the rest of the world.
23/07/2026 08:28 6.5 points
Topic
The pie charts below compare water usage in San Diego, California and the rest of the world.
Word count: 154
Chart/Graph
Essay
Overall Scores
6.5±0.5
Fair
Writing Criteria Scores
TA7.0
CC7.0
LR6.0
GRA6.0
Click on any highlighted text in the essay to view detailed suggestions for improvement.
Deep Analysis
Task 1 - Academic Writing
4 tools available
Sample Essay - IELTS Writing Task 1
No sample essay
Click the button below to analyze and generate a high-quality sample essay for Task 1.