
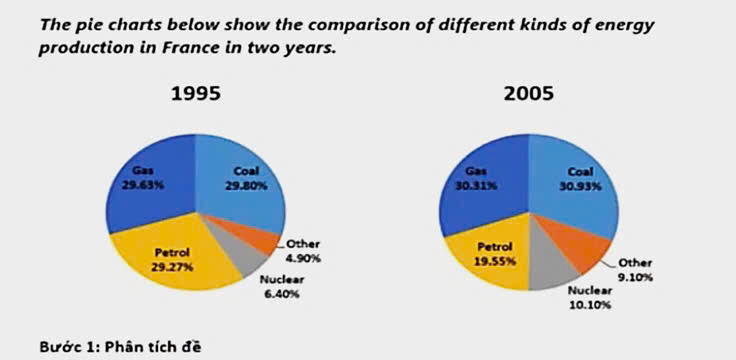
The two pie charts illustrate the percentage of energy produced from five distinct sources in France over a period of 10 years, commencing from 1995. It is clearly seen that the proportions of energy production from gas, coal, other and nuclear power witnessed an upward trend, while the figure for petrol saw a downward tendency. Meanwhile, the one for coal exceeded the others in both year. Looking at the two largest categories, 29.80% was the percentage of energy productions from coal in 1995, before rising to 30.9% in 2005. Similarly, gas increased slightly from 29.63% to 30.31% over the same period. Regarding the others, in 1995, the proportion of energy producted from petrol accounted for 29.27%. However this figure experience a substantial decrease to 19.55% in 2005. Likewise, the percentage of energy production from nuclear upsurge considerable from 6.40% to 10.10% during the 10 year period. The correspondingly figure for other sources also climbed significantly from from 4.90% in 1995 to 9.10% in 2005.
নমুনা বিস্তারিত
the pie charts below show the comparison of differenct kinds of energy productions in france in two years
23/07/2026 08:39 6.5 স্কোর
টপিক বা বিষয়
the pie charts below show the comparison of differenct kinds of energy productions in france in two years
শব্দ সংখ্যা: 164
চার্ট/গ্রাফ
Essay
সামগ্রিক স্কোর
6.5±0.5
মোটামুটি
রাইটিং মানদণ্ড স্কোর
TA7.0
CC7.0
LR6.0
GRA6.0
উন্নতির জন্য বিস্তারিত পরামর্শ দেখতে প্রবন্ধের হাইলাইট করা যেকোনো লেখায় ক্লিক করুন।
গভীর বিশ্লেষণ
Task 1 - Academic Writing
4 tools available
নমুনা রচনা - IELTS Writing Task 1
কোনো নমুনা রচনা নেই
টাস্ক ১-এর জন্য উচ্চমানের নমুনা রচনা বিশ্লেষণ এবং তৈরি করতে নিচের বাটনে ক্লিক করুন।