
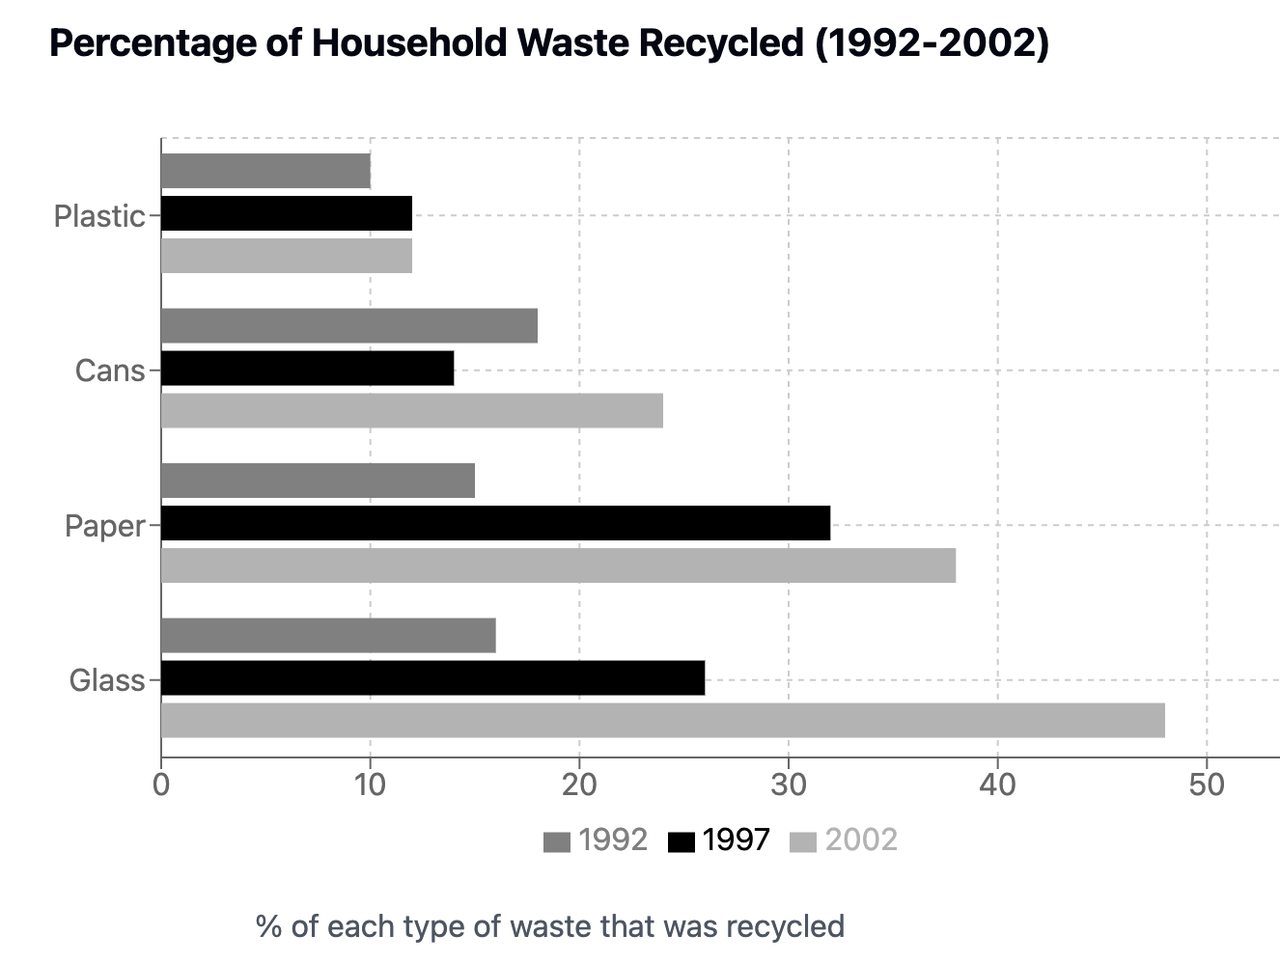
The chart illustrates the proportion of four type of household waste recycled between 1992 and 2002. Overall, glass was the most waste that recycled during a decade, plastic had lower rate of waste recycle. There were different type of household waste that were recycled including: plastic, cans, paper, and glass. In 2002, the ratio of highest recycled glass stand at 48% and the plastic had lower rate around 13%. In 1997, the paper accounted for 32% that was highest ratio instead of glass, but plastic still was household waste that was recycled differently when it had lower percentage in all of type of waste. In 1992, cans became commonly recycled waste which accounted for nearly 20%, paper and glass had similar proportions that were lower than cans only about 3%. The plastic was always the smallest rate waste during a decade. In short, glass and paper were two type of advantage waste because they easily recycled to different products to protect environment.
Sample Detail
The chart below shows the percentages of different types of household waste that were recycled in one city between 1992 and 2002. Summarise the information by selecting and reporting the main features, and make comparisons where relevant.
23/07/2026 08:39 5.5 points
Topic
The chart below shows the percentages of different types of household waste that were recycled in one city between 1992 and 2002. Summarise the information by selecting and reporting the main features, and make comparisons where relevant.
Word count: 162
Chart/Graph
Essay
Overall Scores
5.5±0.5
Basic
Writing Criteria Scores
TA6.0
CC6.0
LR5.0
GRA5.0
Click on any highlighted text in the essay to view detailed suggestions for improvement.
Deep Analysis
Task 1 - Academic Writing
4 tools available
Sample Essay - IELTS Writing Task 1
No sample essay
Click the button below to analyze and generate a high-quality sample essay for Task 1.