
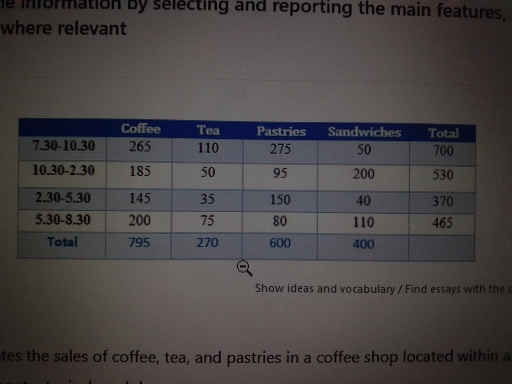
The given spreadsheet demonstrates the sales made by a cafe in an office building on one of the working days. Coffee, tea, pasteries and sandwiches are the items that are sold. Broadly, according to the data, it can be observed that coffee sales are the highest figure, whereas, tea was the least traded item throughout the day. During the first time slot - from 7.30 to 10.30, the coffeeshop sold 700 items in total. More than half of it is accounted from coffee and pastries, 265 and 275, respectfully. The smallest quantity during this period is sandwiches, as they are sold only 50 pieces. In contrast, during the next period of time, from 10.30 to 2.30, there is a one-forth increase in sales of sandwiches, whereas, coffee, tea and pastry sales decreased. Between 2.30 and 5.30, overall drop can be noticed, however, pastry sales increased approximately 50 percent, which made up about the half of the overall sales in the referred 2 hours. Followed by 5.30 to 8.30, coffee sales rose from 145 to 200 and sandwich sales went up drastically from 40 to 110, which means, 300 percent, roughly.
Sample Detail
The table below shows the sales made by a coffee shop in an office building on a typical weekday. Summarise the information by selecting and reporting the main features, and make comparisons where relevant.
23/07/2026 08:46 6.0 points
Topic
The table below shows the sales made by a coffee shop in an office building on a typical weekday. Summarise the information by selecting and reporting the main features, and make comparisons where relevant.
Word count: 190
Chart/Graph
Essay
Overall Scores
6.0±0.5
Fair
Writing Criteria Scores
TA6.0
CC7.0
LR6.0
GRA6.0
Click on any highlighted text in the essay to view detailed suggestions for improvement.
Deep Analysis
Task 1 - Academic Writing
4 tools available
Sample Essay - IELTS Writing Task 1
No sample essay
Click the button below to analyze and generate a high-quality sample essay for Task 1.