
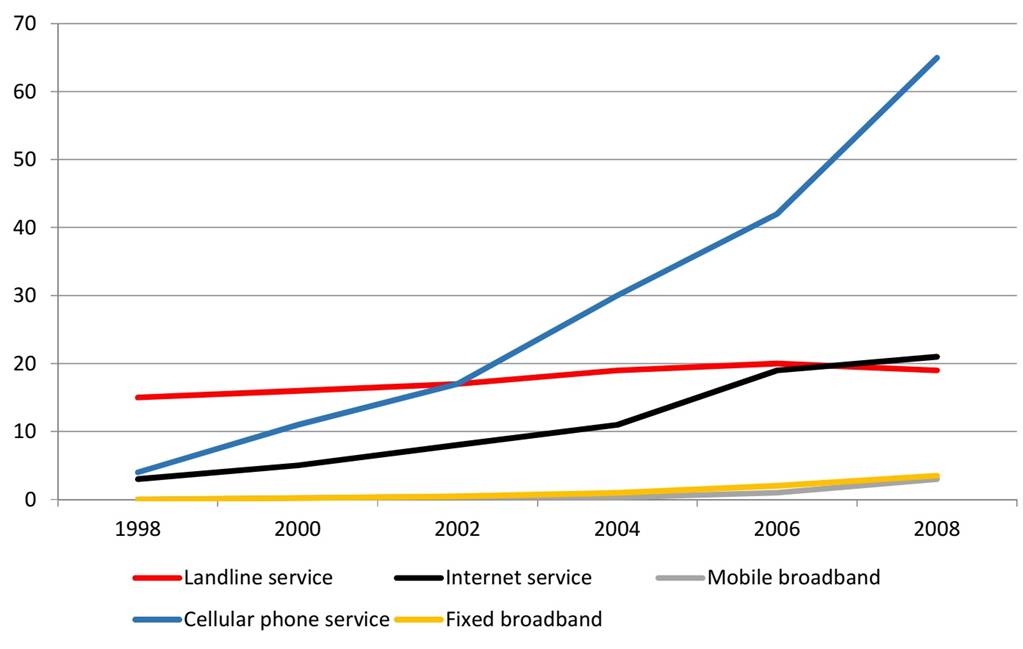
The line graph provided compares the percentage of various communication services users worldwide from 1998 to 2008. Overall, the proportion of people using all 5 communication services increased over the period, with the figures for cellular phone service witnessing the most dramatic spike, while mobile broadband users rose modestly and by far remained the lowest. About 15 per 100 inhabitants used landline service in 1998, followed by a gradual growth to 20% over 8-year time before ending with a slight fall to roughly 19% in 2008. While starting at a smaller number of around 5 per 100 inhabitants, the share for cellular phone service soon increased approximately 60% throughout the period, surpassing the figures for landline service to occupy the leading users from 2002 onward. To a smaller extent, the percentage of internet service users rose considerably from nearly 3% to 20% between 1998 and 2006, with a final slight increase to over 20% in 2008, overtaking the landline service to rank second in the sector. In contrast, the proportion of fixed and mobile broadband users remained virtually unchanged at 0% from 1998 to 2003, after which they experienced a marginal increase to about 4% in 2008. Despite the same patterns, mobile broadband users still held the lowest share throughout the 10-year period.
Detail Sampel
The line graph shows the number of people who used different communication services in the world. Summarise the information by selecting and reporting the main features, and make comparisons where relevant. Write at least 150 words. Units: per 100 inhabitants
23/07/2026 08:47 7.0 skor
Topik
The line graph shows the number of people who used different communication services in the world. Summarise the information by selecting and reporting the main features, and make comparisons where relevant. Write at least 150 words. Units: per 100 inhabitants
Jumlah kata: 213
Grafik/Diagram
Essay
Skor Keseluruhan
7.0±0.5
Baik
Skor Kriteria Writing
TA7.0
CC7.0
LR7.0
GRA7.0
Klik teks yang ditandai di esai untuk melihat saran detail untuk peningkatan.
Analisis mendalam
Task 1 - Academic Writing
4 tools available
Esai contoh - IELTS Writing Task 1
Belum ada esai contoh
Silakan klik tombol di bawah untuk menganalisis dan membuat esai contoh berkualitas tinggi untuk Task 1.