
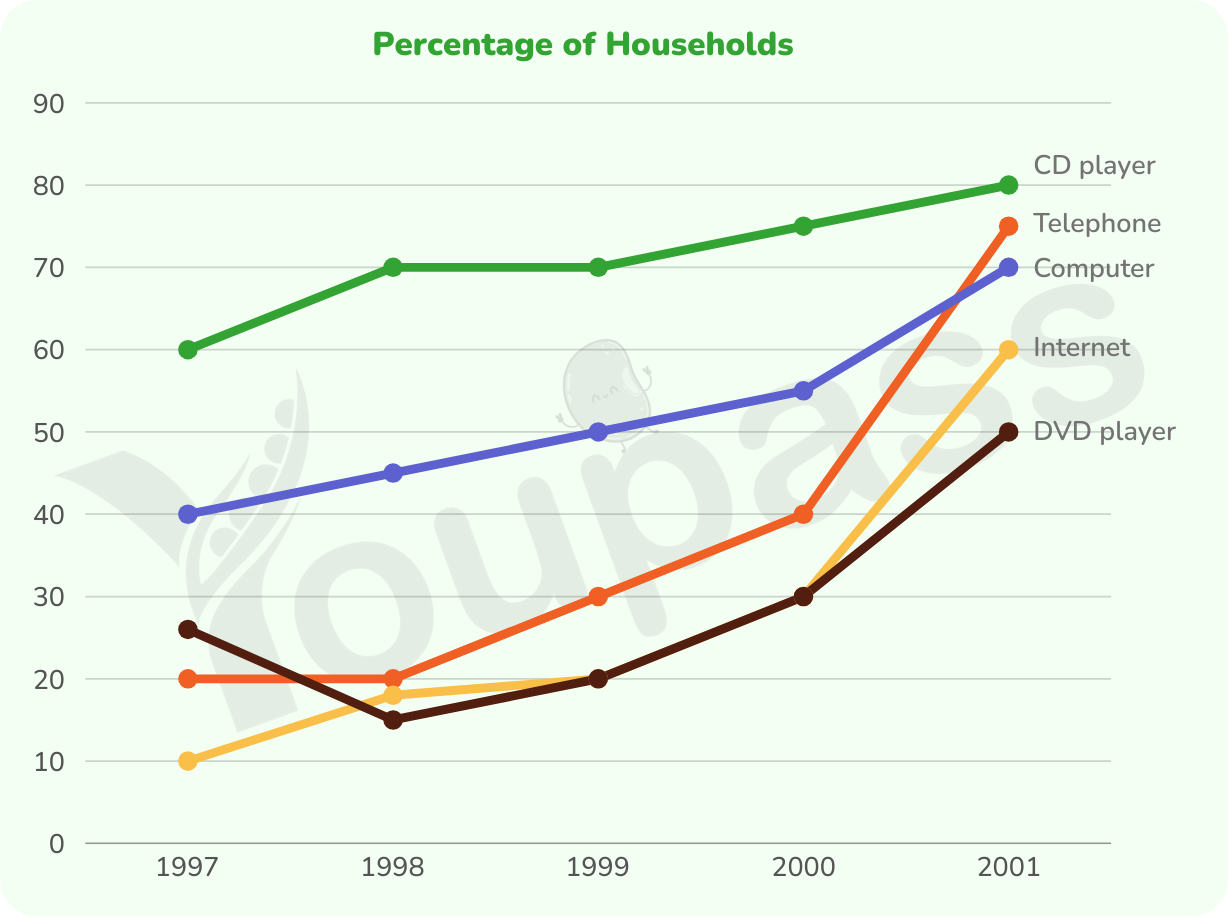
The provided line graph compares the proportion of households equipped with different types of technology in the UK between 1997 and 2001. The percentage of households using these five tools increased throughout the period. CD player accounted for the largest, while the figure for DVD player made up the smallest proportion almost the period. In 1997, the share of CD player was the largest of five tools, at 60%, then it increased significantly to 70% in 1998 before remaining unchanged in the following year. The figure continued to rise moderately to reach its peak at 80% in 2001. The proportion of households using computer also demonstrated an upward trend, it climbed from 40% in 1997 to 55% in 2000, and rose remarkably to 70% by the end of the period. Households using telephone accounted for 20% in 1997; after remaining unchanged in the following year, the figure increased dramatically to 40% in 2000, and climbed more quickly in 75% by the end of the period. The two remaining technology tools also demonstrated the same pattern. The percentage of households which were equipped with DVD player began at approximately 28%, then it declined to 15% in 1998 before recovering to 30% in 2000 and ended at 50% in 2001. The percentage for Internet climbed from 10% in 1997 to 20% in 1999, after that it matched the figure for DVD player in the following year. Finally, it increased sharply to 60% by the end of the period.
Detail Sampel
The graph below shows the percentage of households with different kinds of technology in the UK from 1997 to 2001. Summarize the information by selecting and reporting the main features, and make comparisons where relevant.
23/07/2026 08:48 6.5 skor
Topik
The graph below shows the percentage of households with different kinds of technology in the UK from 1997 to 2001. Summarize the information by selecting and reporting the main features, and make comparisons where relevant.
Jumlah kata: 246
Grafik/Diagram
Essay
Skor Keseluruhan
6.5±0.5
Cukup
Skor Kriteria Writing
TA7.0
CC7.0
LR7.0
GRA6.0
Klik teks yang ditandai di esai untuk melihat saran detail untuk peningkatan.
Analisis mendalam
Task 1 - Academic Writing
4 tools available
Esai contoh - IELTS Writing Task 1
Belum ada esai contoh
Silakan klik tombol di bawah untuk menganalisis dan membuat esai contoh berkualitas tinggi untuk Task 1.