
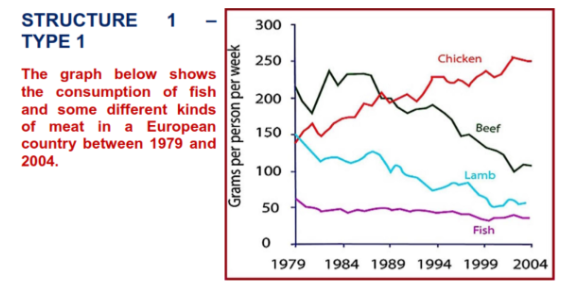
The line graph depicts the weekly consumption of beef, chicken, lamb, and fish in a European nation between 1974 and 2004, measured in grams per person. Overall, chicken and beef were the most widely consumed during the period. In contrast, lamb witnessed a dramatic decrease, while fish remained relatively stable during the period. In 1979, the volume of chicken eaten was around 150 grams, which was significantly higher than that for fish at around 60 grams. Chicken rose substantially and eventually overtook beef around 1989, and reached approximately 250 grams in 2004. Meanwhile, fish intake showed a slight decrease from around 60 grams to just under 50 grams per person. Regarding the other meats, the volume of beef was highest, with around 230 grams being consumed, which was higher than the figure for lamb in 1979. Beef consumption fluctuated over the period from 1979 to around 1986 before declining sharply to about 100 grams in 2004. Likewise, the amount of lamb decreased significantly to just around 60 grams weekly.
รายละเอียดตัวอย่าง
measured in grams per person.
23/07/2026 08:50 7.0 คะแนน
หัวข้อ
measured in grams per person.
จำนวนคำ: 169
แผนภูมิ/กราฟ
Essay
คะแนนรวม
7.0±0.5
ดีมาก
คะแนนเกณฑ์การเขียน
TA7.0
CC7.0
LR7.0
GRA7.0
คลิกข้อความที่ไฮไลต์ในเรียงความเพื่อดูคำแนะนำรายละเอียดเพื่อพัฒนา
การวิเคราะห์เชิงลึก
Task 1 - Academic Writing
4 tools available
บทความตัวอย่าง - IELTS Writing Task 1
ยังไม่มีบทความตัวอย่าง
กดปุ่มด้านล่างเพื่อวิเคราะห์และสร้างบทความตัวอย่างคุณภาพสูงสำหรับ Task 1