
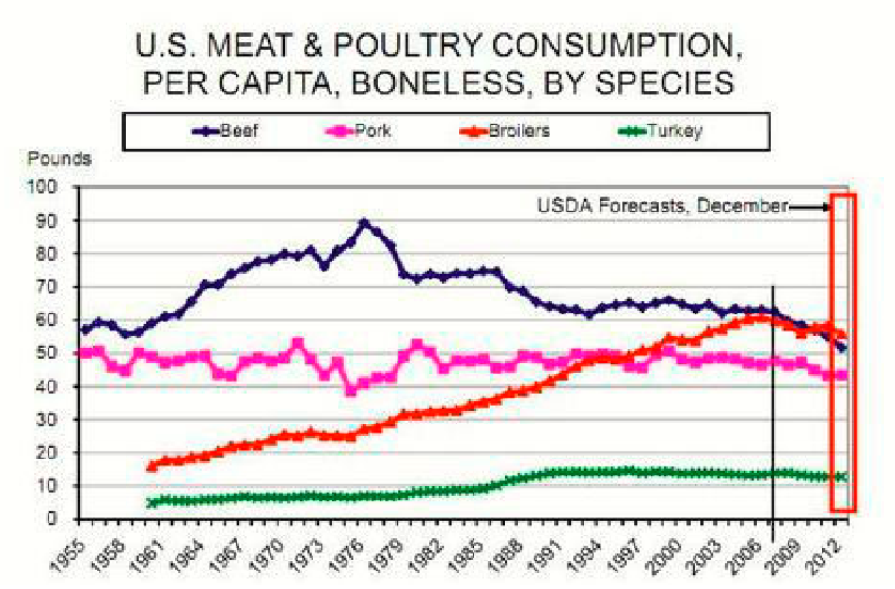
The line graph illustrates the amount of various type meat and poultry consumption person in the us over a 57-year during the period 1955 to 2012 Overall, during the period 1955 to 2012, beef was the most consumed species, while the least popular meat turkey. Beside, the consumption of broilers increased significantly, the amount of pork remained and didn’t have change. In 1955, beef consumption was about pounds and pork consumption was 50 pounds. By 1961, people were started consuming broilers about 17 pounds and turkey about 7 pounds, while the amount of beef and pork saw little changes. From 1961 to 1976, consumption of beef increased considerably and reached a peak of 90 pounds. Besides, consumption of pork decreased about 40 pounds, broilers was consumed increasing and turkey comsumption remained stable. From 1976 to 1997, the amount of beef consumed decreased considerably, while, broilers consumed creased significantly about 50 pounds competible with pork consumption. By 2012, beef consumption hit a low of 50 pounds. In contrast, broilers consumption reached a peak of 55 pounds. Beside, the amount of pork and turkey fluctuated slightly.
নমুনা বিস্তারিত
The graph below shows trends in US meat and poultry consumption.
23/07/2026 08:53 5.0 স্কোর
টপিক বা বিষয়
The graph below shows trends in US meat and poultry consumption.
শব্দ সংখ্যা: 184
চার্ট/গ্রাফ
Essay
সামগ্রিক স্কোর
5.0±0.5
প্রাথমিক
রাইটিং মানদণ্ড স্কোর
TA5.0
CC5.0
LR5.0
GRA5.0
উন্নতির জন্য বিস্তারিত পরামর্শ দেখতে প্রবন্ধের হাইলাইট করা যেকোনো লেখায় ক্লিক করুন।
গভীর বিশ্লেষণ
Task 1 - Academic Writing
4 tools available
নমুনা রচনা - IELTS Writing Task 1
কোনো নমুনা রচনা নেই
টাস্ক ১-এর জন্য উচ্চমানের নমুনা রচনা বিশ্লেষণ এবং তৈরি করতে নিচের বাটনে ক্লিক করুন।