
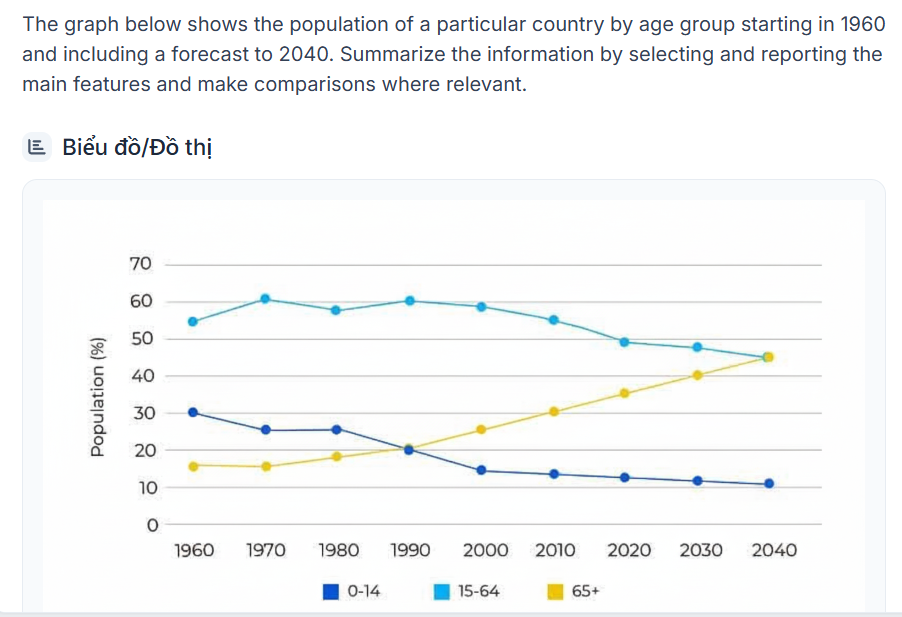
The given line graph illustrates the proportion of the population in three different age groups in Japan from 1960 to 2040, with the figures after 2020 being projections. Overall, people aged 15-64 consistently represented the highest proportion of the population throughout the period despite a projected decline towards the end of the period. In contrast, the proportion of children fell steadily, whereas the percentage of elderly people increased continuously and is forecast to equal that of the 15–64 age group by 2040. Looking first at the 15-64 age group, this category accounted for the highest percentage of the population over the period. Its figure rose from approximately 55% in 1960 to 60% in 1970, fluctuated slightly until 2000 and then declined considerably to around 45% by 2040. By comparison, the proportion of the 0-14 age group decreased steadily throughout the period, dropping from nearly 30% in 1960 to over 10% in 2040. Meanwhile, the percentage of people aged 65 and over followed an opposite trend, increasing steadily from roughly 16% in 1960 to 45% in 2040. It equalled the figure for 0-14 age group in 1990 before surpassing it in the following decade. Additionally, by the end of the period, the proportion of elderly people is forecast to catch up with that of the 15-64 age group, both accounting for about 45% of the population in 2040.
Sample Detail
The line graph below shows the percentage of the population in Japan in three different age groups between 1960 and 2040. Summarise the information by selecting and reporting the main features, and make comparisons where relevant.
23/07/2026 08:56 6.5 points
Topic
The line graph below shows the percentage of the population in Japan in three different age groups between 1960 and 2040. Summarise the information by selecting and reporting the main features, and make comparisons where relevant.
Word count: 227
Chart/Graph
Essay
Overall Scores
6.5±0.5
Fair
Writing Criteria Scores
TA7.0
CC6.0
LR7.0
GRA7.0
Click on any highlighted text in the essay to view detailed suggestions for improvement.
Deep Analysis
Task 1 - Academic Writing
4 tools available
Sample Essay - IELTS Writing Task 1
No sample essay
Click the button below to analyze and generate a high-quality sample essay for Task 1.