
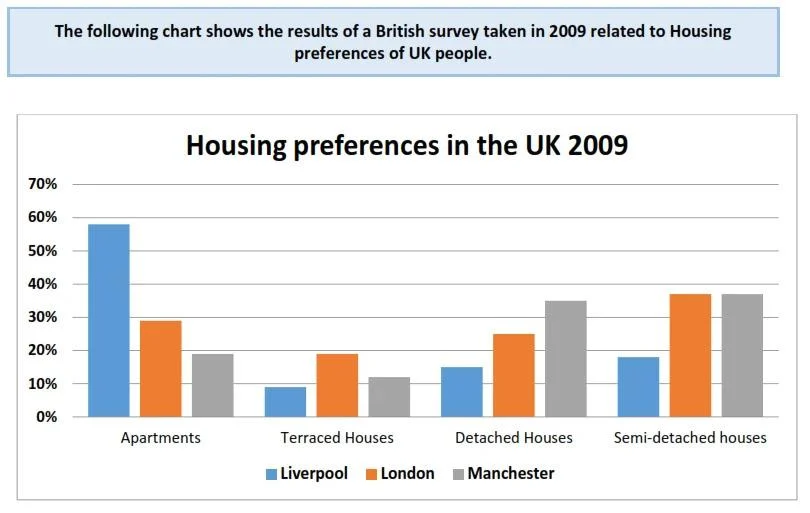
The bar graph illustrates the data of an English survey carried on in 2009 involving in accommodation preferences of residents settling in the UK. Overall, we can see that people living in Liverpool lean towards apartments more than other houses. In contrast, London and Manchester saw more similar percentages in their citizens’ options of shelters. Regarding the flats, Liverpool made up the highest percentage of people choosing this type of house, at nearly 60%, doubling the figure for the capital and tripling the rate of Manchester. Turning to Terraced houses, London dominated this accommodation with around 20% of its residents’ choice, while Liverpool and Manchester recorded lower number, at around 10% for both places. In terms of Detached houses, Manchester’s percentage of people living in those constructions accounted for about 35%, exceeding the figures for Liverpool and London, at 15% and 25%, respectively. As for Semi-detached accommodation, London and Manchester had a match in the rate of this type of house’s owners, at under 40%. In contrary, Liverpool reported only nearly 20% of their residents choosing to build a life in this kind of home.
Detail Sampel
The following chart shows the results of a British survey taken in 2009 related to Housing preferences of UK people.
23/07/2026 08:58 7.0 skor
Topik
The following chart shows the results of a British survey taken in 2009 related to Housing preferences of UK people.
Jumlah kata: 185
Grafik/Diagram
Essay
Skor Keseluruhan
7.0±0.5
Baik
Skor Kriteria Writing
TA7.0
CC7.0
LR7.0
GRA7.0
Klik teks yang ditandai di esai untuk melihat saran detail untuk peningkatan.
Analisis mendalam
Task 1 - Academic Writing
4 tools available
Esai contoh - IELTS Writing Task 1
Belum ada esai contoh
Silakan klik tombol di bawah untuk menganalisis dan membuat esai contoh berkualitas tinggi untuk Task 1.