
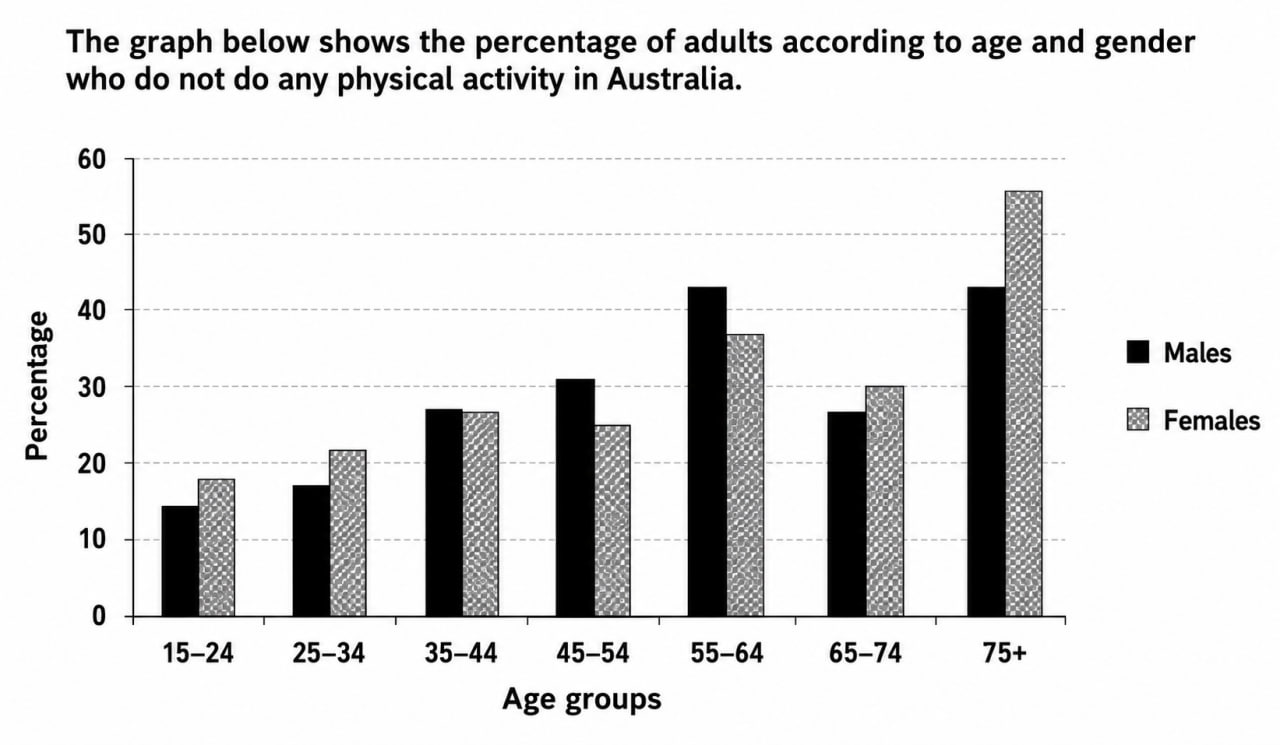
The bar chart illustrates the proportion of people who do not do any physical activity in Australia. Overall, According to Statistics females were more inactive in most age group compared to males. Whereas the proportion of males was less active in 45-54 and 55-64.It is also clear that there was a noticeable disparity between the proportion of people in age 75+. Focusing on the first two age cohorts — those aged 15-24 and 25-34, all of them represented higher rates of inactive overall compared to male counterparts. As for the people aged 35-44 rates were equal account for 28%. In people aged 45-54 and 55-64 males were more less active accounted for 30% and 43% respectively. The remaining two last people aged group 65-74 women were constituted 30%. Men were accounted for 28%. Similarly, people aged 75 + proportion of females dominated accounted for 55%.As for the percentage of males allowed for 42%
Sample Detail
The graph below shows the percentage of adults according to age and gender who do not do any physical activity in Australia.
23/07/2026 09:04 6.0 points
Topic
The graph below shows the percentage of adults according to age and gender who do not do any physical activity in Australia.
Word count: 153
Chart/Graph
Essay
Overall Scores
6.0±0.5
Fair
Writing Criteria Scores
TA6.0
CC7.0
LR6.0
GRA5.0
Click on any highlighted text in the essay to view detailed suggestions for improvement.
Deep Analysis
Task 1 - Academic Writing
4 tools available
Sample Essay - IELTS Writing Task 1
No sample essay
Click the button below to analyze and generate a high-quality sample essay for Task 1.