
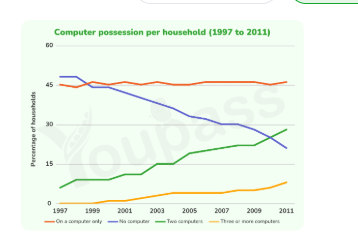
This line graph shows the increase in computer possession by households in a European country from 1997 to 2011. Overall, there are both significant and slight changes. Firstly, there were dramatic changes in the number of no computers or two computers per household. Particularly, we can see the significant increase in two-computer possession per household from about 5 percent in 1997 to 28 percent in 2011. In contrast, no computer possession per household declined greatly from about 49 percent to 22 percent over 14 years. On the other hand, there were a light changes in on a computer only and three or more computers per household over 14 years. From 1997 to 2011, on a computer only remained stable at around 45 percent. For three or more computers, there was a small change from 0 percent to 9 percent from 1997 to 2011. In conclusion, this European country had a major shift in computer possession per household over 14 years.
Detail Sampel
The graph below gives information about computer possession by household in one European country between 1997 and 2011. Summarise the information by selecting and reporting the main features, and make comparisons where relevant.
23/07/2026 09:06 6.0 skor
Topik
The graph below gives information about computer possession by household in one European country between 1997 and 2011. Summarise the information by selecting and reporting the main features, and make comparisons where relevant.
Jumlah kata: 160
Grafik/Diagram
Essay
Skor Keseluruhan
6.0±0.5
Cukup
Skor Kriteria Writing
TA6.0
CC6.0
LR6.0
GRA6.0
Klik teks yang ditandai di esai untuk melihat saran detail untuk peningkatan.
Analisis mendalam
Task 1 - Academic Writing
4 tools available
Esai contoh - IELTS Writing Task 1
Belum ada esai contoh
Silakan klik tombol di bawah untuk menganalisis dan membuat esai contoh berkualitas tinggi untuk Task 1.