
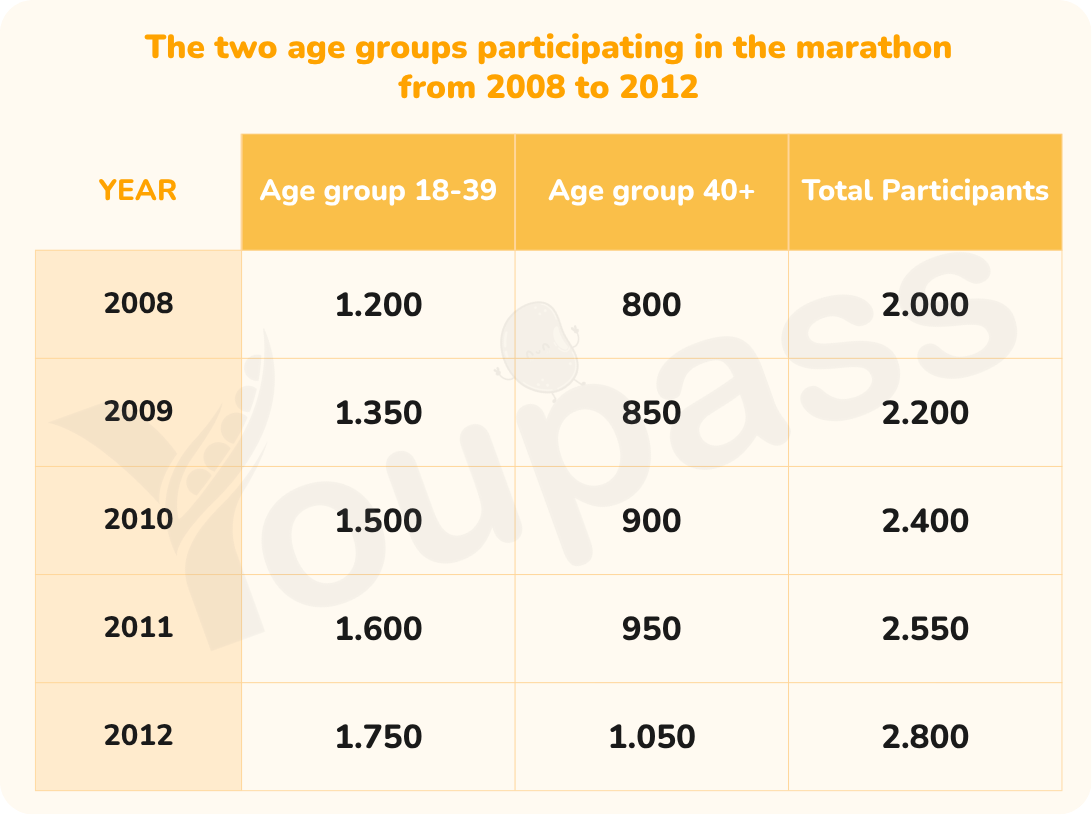
The chart illustrates the number of people taking part in the marathon in two age ranges between 2008 and 2012 Overall, the number of people in two age groups participating in the marathon both experienced an stable upward trend and continuous rise. Notably, the 18-39 age group had more active participation than the 40 and over age group. In 2008, there were 1200 participants aged 18-39, compared to 800 people aged 40 and over. The figure for both groups then increased steadily. The number of people aged 18-39 climbing to roughly at 1500 in 2010 and finishing the period at 1750 in 2012. Elderly group jumped slightly from 800 to 950 in 2011 and reached 1050 at the end of the period. An upward trend was observed in both age group; however, younger group shows a stronger increase than elderly group. Two groups both have more participants that means the total of participation also rose marginally from 2000 in 2008 to 2800 in 2012.
รายละเอียดตัวอย่าง
The table shows the two age groups participating in the marathon from 2008 to 2012. Summarize the information by selecting and reporting the main features, and make comparisons where relevant.
23/07/2026 09:07 6.0 คะแนน
หัวข้อ
The table shows the two age groups participating in the marathon from 2008 to 2012. Summarize the information by selecting and reporting the main features, and make comparisons where relevant.
จำนวนคำ: 164
แผนภูมิ/กราฟ
Essay
คะแนนรวม
6.0±0.5
ดีพอใช้
คะแนนเกณฑ์การเขียน
TA7.0
CC6.0
LR6.0
GRA6.0
คลิกข้อความที่ไฮไลต์ในเรียงความเพื่อดูคำแนะนำรายละเอียดเพื่อพัฒนา
การวิเคราะห์เชิงลึก
Task 1 - Academic Writing
4 tools available
บทความตัวอย่าง - IELTS Writing Task 1
ยังไม่มีบทความตัวอย่าง
กดปุ่มด้านล่างเพื่อวิเคราะห์และสร้างบทความตัวอย่างคุณภาพสูงสำหรับ Task 1