
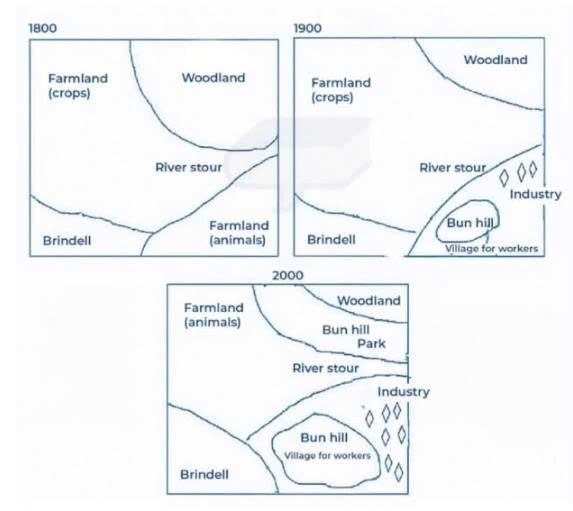
The given maps illustrate how an area around the River Stour was transformed between 1800 and 2000. From an overall perspective, it is evident that the area experienced significant urban and industrial development over the 200-year period. While farmland and woodland were partly converted into industrial and residential facilities, Brindell and the River Stour remained largely unchanged. Looking at the eastern part of the area first, in 1800, woodland was located in the northeast, while farmland for animals stood in the southeast. By 1900, part of the woodland had been replaced by industry, with a village for workers and Bun Hill being added to the south of the river. Meanwhile, the remaining woodland remained in the northeast, although it became slightly smaller. As for the remaining part of the area, the most notable change was the conversion of the farmland for crops into farmland for animals by 2000. Bun Hill, which originally stood to the south of the river in 1900, was relocated slightly to the north and made way for a park. Elsewhere, the industrial area was expanded further south and east, whereas Brindell and the River Stour remained in their original locations.
Sample Detail
Task 1: The graphs below show the development of Brindell from 1800 to 2000. Summarize the information by selecting and reporting the main features, and make comparisons where relevant.
23/07/2026 09:08 6.5 points
Topic
Task 1: The graphs below show the development of Brindell from 1800 to 2000. Summarize the information by selecting and reporting the main features, and make comparisons where relevant.
Word count: 194
Chart/Graph
Essay
Overall Scores
6.5±0.5
Fair
Writing Criteria Scores
TA6.0
CC7.0
LR7.0
GRA7.0
Click on any highlighted text in the essay to view detailed suggestions for improvement.
Deep Analysis
Task 1 - Academic Writing
4 tools available
Sample Essay - IELTS Writing Task 1
No sample essay
Click the button below to analyze and generate a high-quality sample essay for Task 1.