
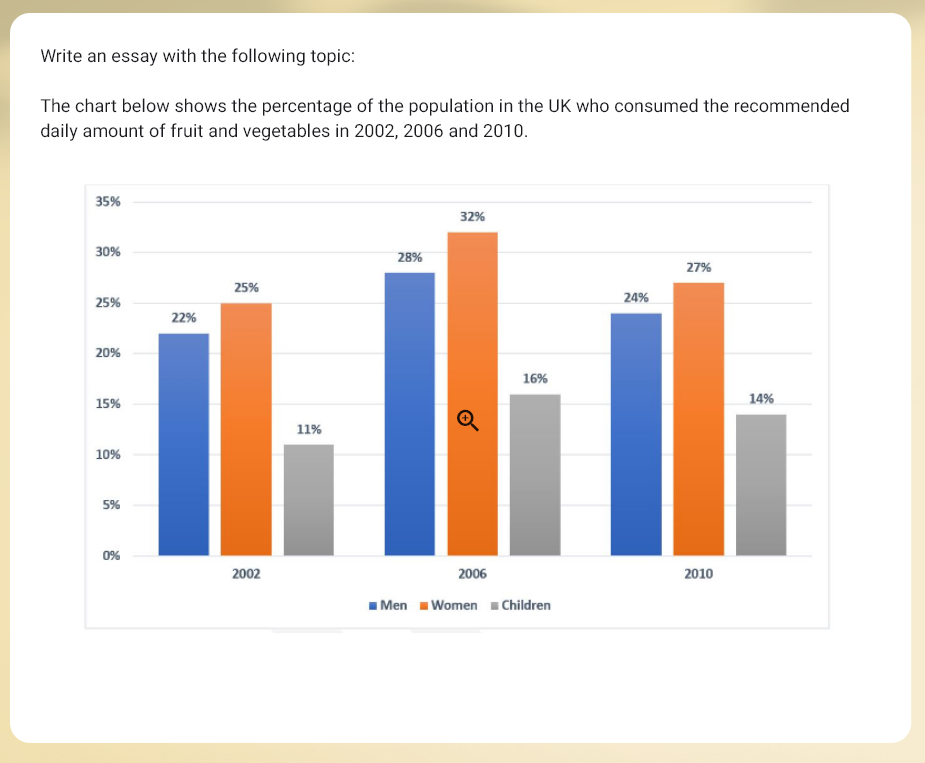
The diagram illustrates the proportion of the inhabitants in the UK who ate the recommended daily intake of fruits and vegetables in 2002, 2006 and 2010. Overall, there was a gradual downward in the percentage of men, women and children over the time frame, while women had the highest proportion of people who consumed the recommended daily amount of fruit and vegetables. In contract, the figure for children was the lowest throughout the period. It can be seen that, the figure for women a slight increase from 2002 to 2006, reaching 25% and 32%, respectively. The trend of men was similar to that of women. It experienced a slight increase from 22% in 2002 to 28% in 2006. Both men and women reaching peaking in 2006 before declining steadily in 2010, with 24% and 27%, respectively. Over the period, children had the lowest proportion. Similar to men and women, children also saw a steady rise to 16% in 2006 before falling to 14% in 2010
Detail Sampel
The chart below the percentage of the population in the UK consumed the recommended daily amount of fruit and vegetables in 2002, 2006 and 2010
23/07/2026 09:16 5.5 skor
Topik
The chart below the percentage of the population in the UK consumed the recommended daily amount of fruit and vegetables in 2002, 2006 and 2010
Jumlah kata: 165
Grafik/Diagram
Essay
Skor Keseluruhan
5.5±0.5
Dasar
Skor Kriteria Writing
TA6.0
CC6.0
LR6.0
GRA5.0
Klik teks yang ditandai di esai untuk melihat saran detail untuk peningkatan.
Analisis mendalam
Task 1 - Academic Writing
4 tools available
Esai contoh - IELTS Writing Task 1
Belum ada esai contoh
Silakan klik tombol di bawah untuk menganalisis dan membuat esai contoh berkualitas tinggi untuk Task 1.