
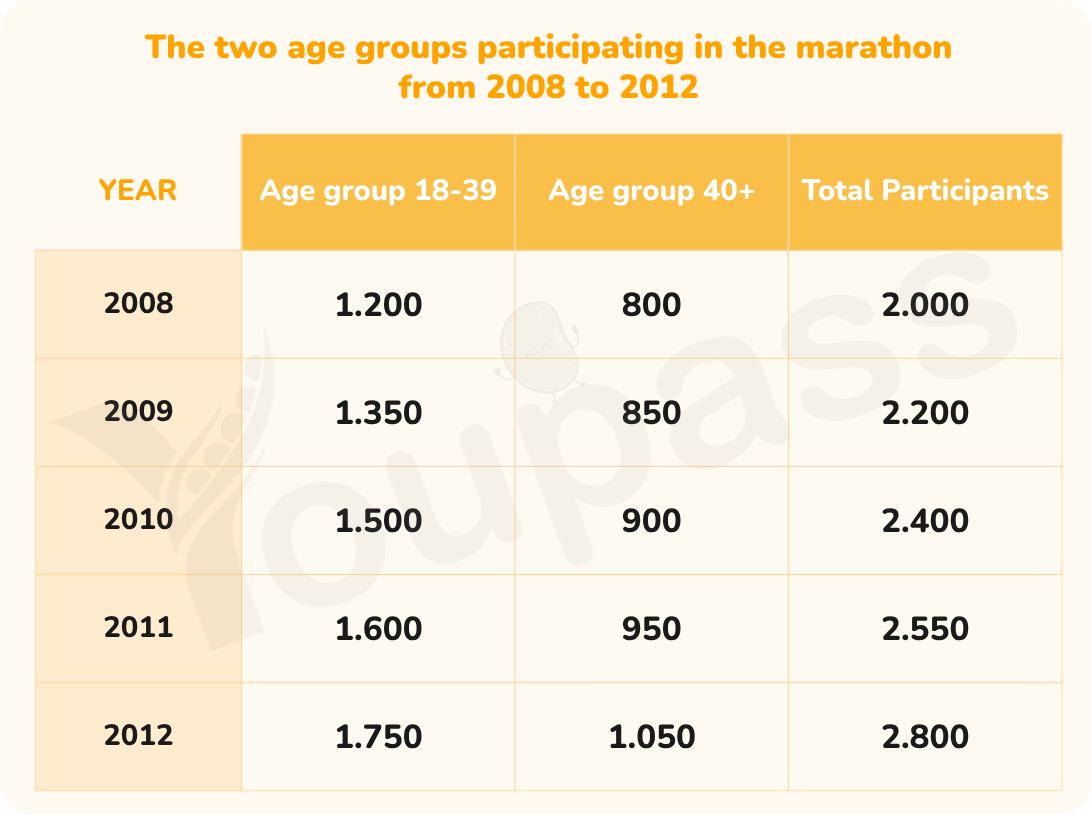
The table illustrates the number of both age groups takes part in the marathon between 2008 and 2012. What is notable from the table is that all the age groups witness an upward trend in all the time. The age group in 18 to 39 always held a top spot during the entire surveyed period, and recoring the increased slighly with 550 person. In 2008, age gruops in 18 to 39 held the highest position higher than 400 person in age group 40+. It double than the figure for older people with 800 person. The number of 18 to 39 age group was increased constantly, with 1,500 person in 2010 ,after that rise to 1,750 person in 2012. Similar, the age group in 40+ was increased from 800 person to 1,050 in 2012. With regard to the total number of marathon runners, 2,000 participants took part in 2008. This figure rose progressively in subsequent years, passing through 2,400 in 2010, before reaching a peak of 2,800 by 2012, representing an overall increase of 800 participants, or 40%, over the five years.
Sample Detail
The table shows the two age groups participating in the marathon from 2008 to 2012. Summarize the information by selecting and reporting the main features, and make comparisons where relevant.
23/07/2026 09:19 5.5 points
Topic
The table shows the two age groups participating in the marathon from 2008 to 2012. Summarize the information by selecting and reporting the main features, and make comparisons where relevant.
Word count: 181
Chart/Graph
Essay
Overall Scores
5.5±0.5
Basic
Writing Criteria Scores
TA6.0
CC6.0
LR5.0
GRA6.0
Click on any highlighted text in the essay to view detailed suggestions for improvement.
Deep Analysis
Task 1 - Academic Writing
4 tools available
Sample Essay - IELTS Writing Task 1
No sample essay
Click the button below to analyze and generate a high-quality sample essay for Task 1.