
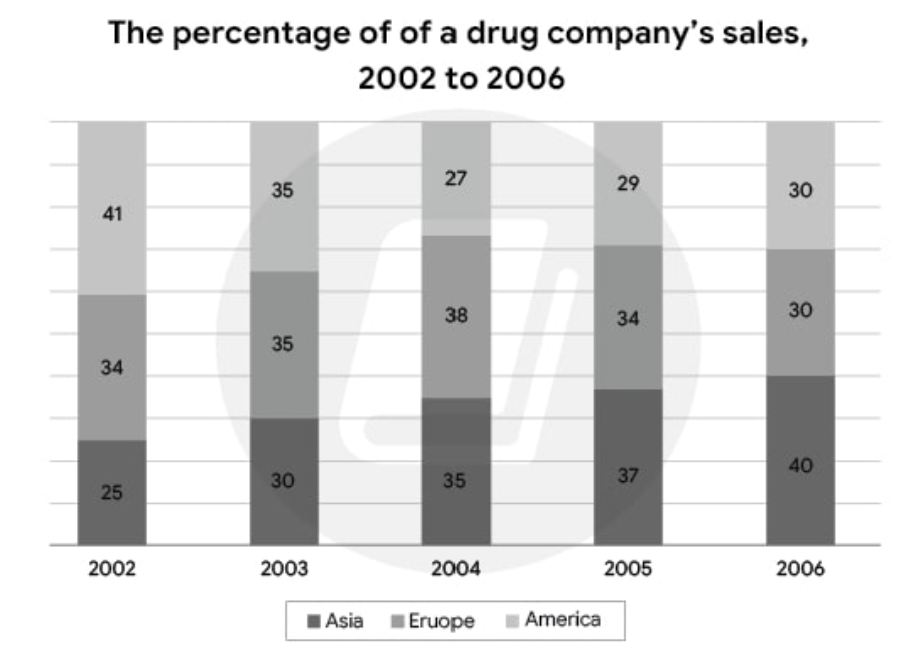
The bar chart compares the percentage of total revenues made by a drug company in distinct regions between 2002 and 2006. Overall, it is evident that the percentage of a drug company sales in Asia showed an upward trend over a 4-year period whereas the figure for America illustrated a downward trend during the period. It is also noticeable that the proportion of a drug's company revenues in Europe fluctuated slightly. From 2002 to 2004, the figure for a drug company's sales in Asia reocrded the lowest figure in 2002, at just 25%, which was considerably than that in Asia and Europe, with the figures of 34% and 41%, respectively. There was a overwhelming increase in those figures in 2003, at 30% for Asia, 35% for Europe and America. In 2004, with the exception of the proportion of a drug company sales in America delcined to 27%, the figure for Asia and Europe registered marginal growth, at 35% and 38%, correspondingly. Between 2005 to 2006, the figure for Asia still rocketed rapidly, with the figures of 37% in 2005 and 40% in 2006, occupided the first place on the entire chart. Conversely, a significant decrease was recorded in the percentage of a drug company's revenues from 34% in 2005 to only three tenths at the end of the period. A simialr trend can be seen in America, with the figures of 29% in 2005. After that there was a slight increase to 30% in 2006
Sample Detail
The chart below illustrates the proportion of total sales made by a drug company in different regions from 2002 to 2006. Provide an overview of the information by identifying and describing the key details, and include comparisons where appropriate.
23/07/2026 09:30 6.0 points
Topic
The chart below illustrates the proportion of total sales made by a drug company in different regions from 2002 to 2006. Provide an overview of the information by identifying and describing the key details, and include comparisons where appropriate.
Word count: 245
Chart/Graph
Essay
Overall Scores
6.0±0.5
Fair
Writing Criteria Scores
TA7.0
CC7.0
LR5.0
GRA6.0
Click on any highlighted text in the essay to view detailed suggestions for improvement.
Deep Analysis
Task 1 - Academic Writing
4 tools available
Sample Essay - IELTS Writing Task 1
No sample essay
Click the button below to analyze and generate a high-quality sample essay for Task 1.